
Computational Benchmarks#
Sphere Leakage#
Sphere Leakage geometrical model#
The Sphere Leakage benchmark is arguably the most important benchmark included in the JADE suite. Indeed, it allows to test individually each single isotope of the nuclear data library under assessment plus some typically used material in the ITER project namely:
Water;
Ordinary Concrete;
Boron Carbide;
SS316L(N)-IG;
Natural Silicon;
Polyethylene (non-borated).
Tungsten
CaF2
Pure Silver
Pure Lead
Al-6061
Al-Bronze
Borated Heavy Concrete
Copper Chromium Zirconium
Eurofer-97
Inconel-718
NbTi
Beryllium
Titanium alloy, Grade 5
SS660
Microtherm
Geometry and run parameters#
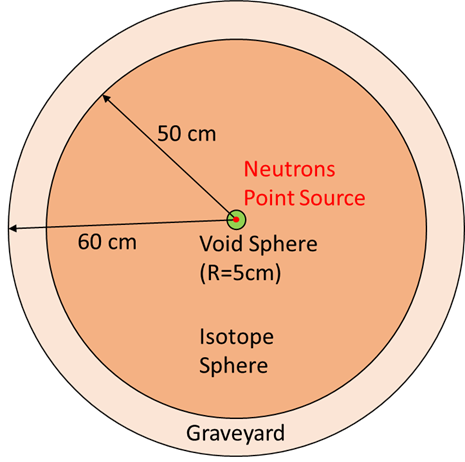
The Sphere Lekage geometry consists of actually three concentric spheres. The inner one is void and has a radius of 5 cm. Here is located the uniform probability 0-14 MeV neutron point source. The second sphere has a radius of 50 cm and it is composed entirely by a single isotope or a typical ITER material. Finally, the last 60 cm radius sphere acts as a graveyard where particles importance is set to zero and the boundary of the model is defined.
Other two important settings that needed to be defined where the the choice of the sphere density and of the MCNP STOP card parameters. Since to impose a single density equal for all materials and zaids was not a valid option, in order to keep some kind of physical meaning in the results, as default densities the one computed using NTP (Normal Temperature and Pressure) conditions were used. These are are defined at 20 °C and 101325 Pa (1 atm). Even if these values work quite well with solids, they cause gases to perform poorly in terms of tally scoring. This happens due to the substantially lower density in NTP conditions for gases when compared to solids, resulting in too few interactions of the neutrons and secondary photons with the material. This has been proven to be especially true for hydrogen and helium, leading to the choice of selecting their liquid phase density instead. Another issue was encountered when simulating fissile isotopes like U235. A 1 m diameter sphere containing a pure fissile isotopes at NTP density is an extremely super-critical geometrical configuration and the high number of secondary particles (i.e. other neutrons) produced caused the simulations to fail due to memory limitations. For this reason, the density of these isotopes was imposed equal to 1 g/cc as if an aerosol was considered. A similar thing was done with the Tungsten, where the nominal density was halved. This has been done to ensure a good enough statistics for the leak fluxes tallies.
STOP cards based on computation time and precision are not available in OpenMC and Serpent, and have been removed as a capability. The only stopping condition currently utilised is the NPS cut-off.
Even after all these optimizations, it is clear to the developers that a “fair” test for all isotopes has not been reached yet. For example, in materials with cross sections having 1/V dependencies, the output of the simulations could be dominated by the cross sections at lower energies. Moreover, particles will not have the same mean free paths in the different spheres meaning that the number of times the cross-sections are sampled will vary, with consequance also on integral results (e.g. heating). In short, some isotopes will necessarly be tested “better” than others. The solution to this issue is not trivial and will certainly receive further attention in future developments. It should be noticed that users can easily modify both density and source parameters at anytime if they do not agree with the default settings that are provided.
Tallies#
Both the transport of neutrons and of secondary photons are active and photons cut-off energy is left to the default value of 1 KeV. The following MCNP tallies are defined in the Sphere Leakage benchmark:
- Tally n. 2
Fine neutron flux at the external surface of the filled sphere. The flux is binned in energy using the Vitamin-J 175 energy group structure.
- Tally n. 12
Coarse neutron flux at the external surface of the filled sphere. The flux is binned in 5 energy groups: 1e-6, 0.1, 1, 10 and 20 MeV.
- Tally n. 32
Fine photon flux at the external surface of the filled sphere. The flux is binned in energy using the 24 group structure described in the FISPACT manual.
- Tally n. 22
Coarse photon flux at the external surface of the filled sphere. The flux is binned in 5 energy groups: 0.01, 0.1, 1, 10 and 20 MeV.
- Tally n. 4
Neutron heating computed in the filled sphere (F4+FM strategy).
- Tally n. 44
Photon heating computed in the filled sphere (F4+FM strategy).
- Tally n. 6
Neutron heating computed in the filled sphere (F6 strategy).
- Tally n. 16
Photon heating computed in the filled sphere (F6 strategy).
- Tally n. 14
Helium (He) ppm production in the filled sphere.
- Tally n. 24
Tritium (T) ppm production in the filled sphere.
- Tally n. 34
Displacement Per Atom (DPA) production in the filled sphere.
Warning
Limitations of additional codes Currently not all of the above tallies are implemented for OpenMC. Tally numbers 4, 44, 14, 24 and 34 are excluded.
See also
Related papers and contributions:
D. Laghi, M. Fabbri, L. Isolan, R. Pampin, M. Sumini, A. Portone and A. Trkov, 2020, “JADE, a new software tool for nuclear fusion data libraries verification & validation”, Fusion Engineering and Design, 161 112075
ITER 1D#
ITER 1D MCNP geometry (quarter)#
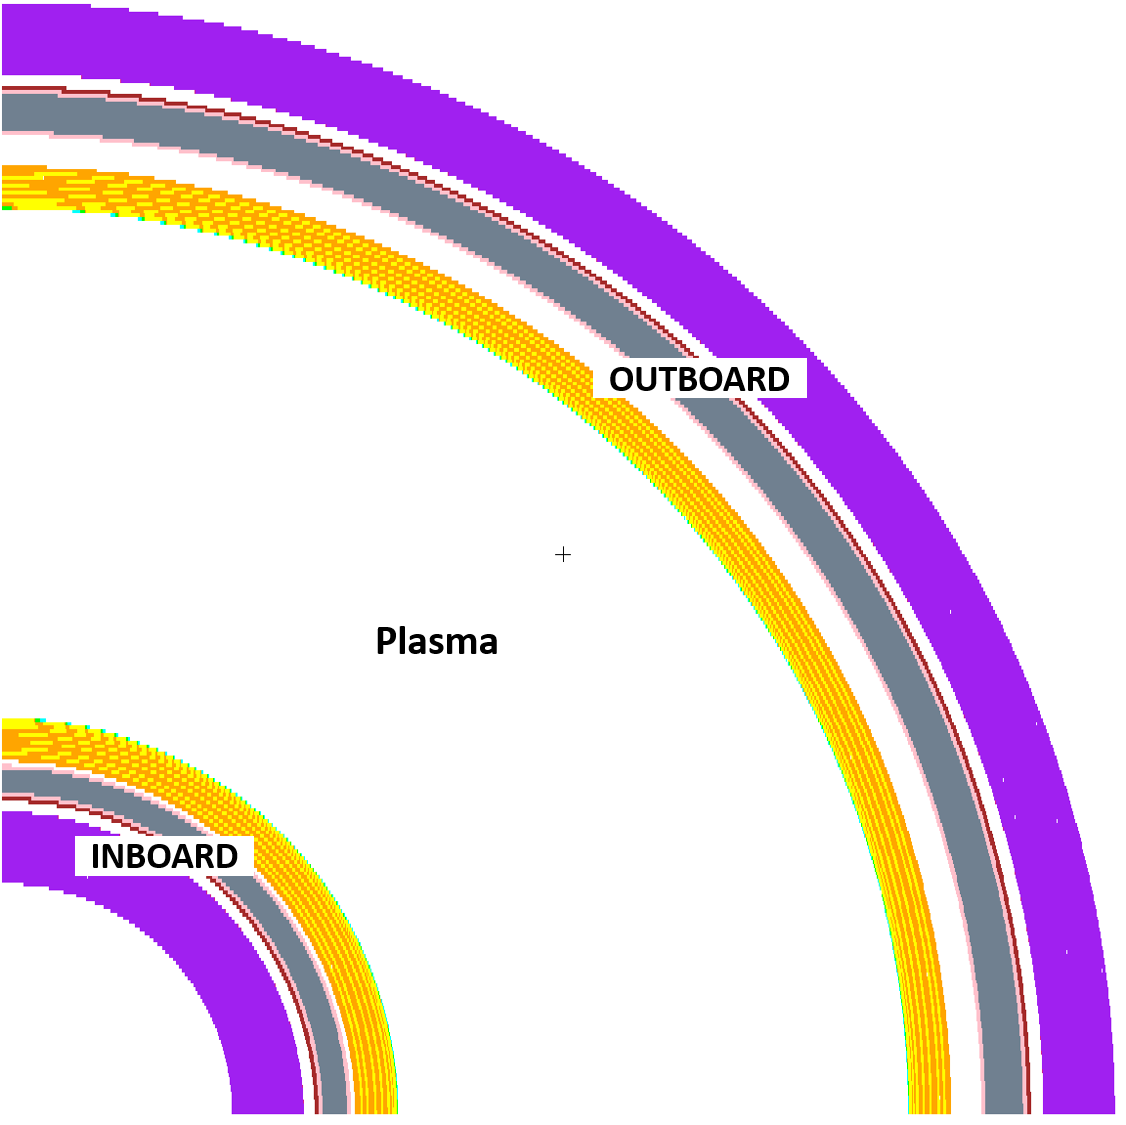
The ITER 1D benchmark developed by Prof. Sawan M. is a popular 1-Dimensional neutronic model used for nuclear data benchmarking in the fusion community. This consists of a simple but realistic model of the ITER TOKAMAK where the inboard and outboard portion of the machine and the plasma region are modelled by means of simple concentric cylindrical surfaces.
Geometry and run parameters#
As visible in the figure, the benchmarks geometry is uniquely composed by concentric cylindrical surfaces. A detailed description of the different layers is reported hereafter:
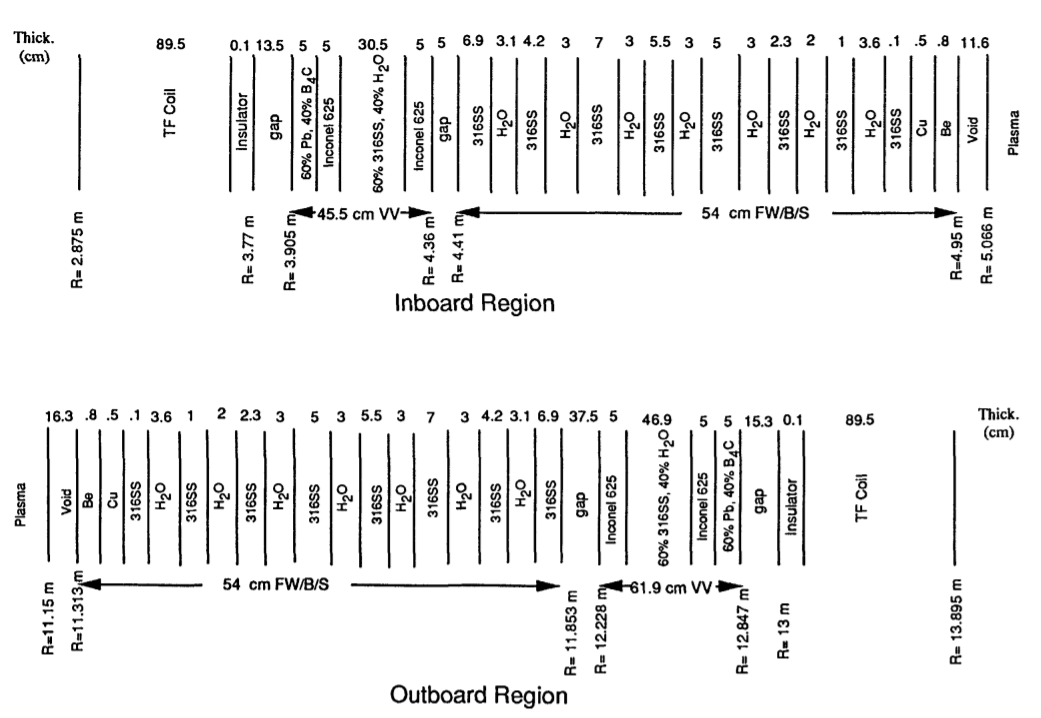
Description of the layers composing the ITER 1D benchmark#
The plasma region includes a 14.1 MeV isotropic neutron source (characteristic of Deuterium-Tritium fusion reaction).
Tallies#
Many quantities are tallied in the ITER 1D benchmark, the following is a thorough description of them.
- Tally n. 4
Neutron flux [#/cm^2] (binned in Vitamin-J 175 energy groups) in 97 different MCNP cells located across the radial direction.
- Tally n. 204
Total neutron flux [#/cm^2] at the same locations as Tally n. 4.
- Tally n. 14
Photon flux [#/cm^2] (binned in energy) at the same locations as Tally n. 4. The energy bins limits are 0.1, 1, 5, 10 and 20.
- Tally n. 214
Total photon flux [#/cm^2] at the same locations as Tally n. 4.
- Tally n.6
Total nuclear heating [W/g], i.e., neutron plus photon heating at the same locations as Tally n. 4.
- Tally n. 16
Neutron heating [W/g] at the same locations as Tally n. 4.
- Tally n. 26
Photon heating [W/g] at the same locations as Tally n. 4.
- Tally n. 34
Helium production in steel.
- Tally n. 44
Hydrogen production in steel.
- Tally n. 54
Tritium production in steel.
- Tally n. 64
Displacement per atom (DPA) in Cu.
- Tally n. 74
Helium production in CuBeNi.
- Tally n. 84
Hydrogen production in CuBeNi.
- Tally n. 94
Tritium production in CuBeNi.
- Tally n. 104
DPA in Nickel.
- Tally n. 114
Helium production in Inconel.
- Tally n. 124
Hydrogen production in Inconel.
- Tally n. 134
Tritium production in Inconel.
- Tally n. 144
Helium production in Be.
- Tally n. 154
Hydrogen production in Inconel.
- Tally n. 164
Tritium production in Inconel.
- Tally n. 174
Fast (E>0.1 MeV) neutron fluence at magnets.
See also
Related papers and contributions:
M. Sawan, 1994, “FENDL Neutronics Benchmark: Specifications for the calculational and shielding benchmark”, (Vienna: INDC(NDS)-316)
Test Blanket Module#
Tritium and Deuterium are the two main ingredients of the fusion reaction that is foreseen to be tested in ITER and that should guarantee sustainable energy production in DEMO. Deuterium is abundant in normal sea water and can be extracted relatively easily. Unfortunately, the same cannot be said for Tritium, whose short half life means that is not readily available in nature. For this reason, in order to be sustainable, TOKAMAKs will need to be able to produce, or “breed” all the tritium needed for their fusion reactions. Tritium breeding is not foreseen for the ITER power plant and the open point will need to be closed by DEMO instead. Nevertheless, ITER is a unique opportunity to test various breeding concepts and find out what will be the best solution to implement in DEMO, leading to the creation of the Test Blanket Module (TBM) project. These are prototypes of blanket sections (and their ancillaries) which have the capability to breed and store tritium for later use.
Building on the historical ITER 1D model, in 2020, two additional benchmark were generated by the F4E neutronic team which had a specific focus on the ITER TBM experiments. The ITER 1D original model was focused on shielding application and did not feature any port in the outboard region. On the contrary, in the new benchmarks, the outboard region was substituted with 1D models of the two proposed European concepts for the TBM: the Helium Cooled Pebbled bed (HCPB) and the Water Cooled Lithium Lead (WCLL). This substitution is the only modification applied to the ITER 1D.
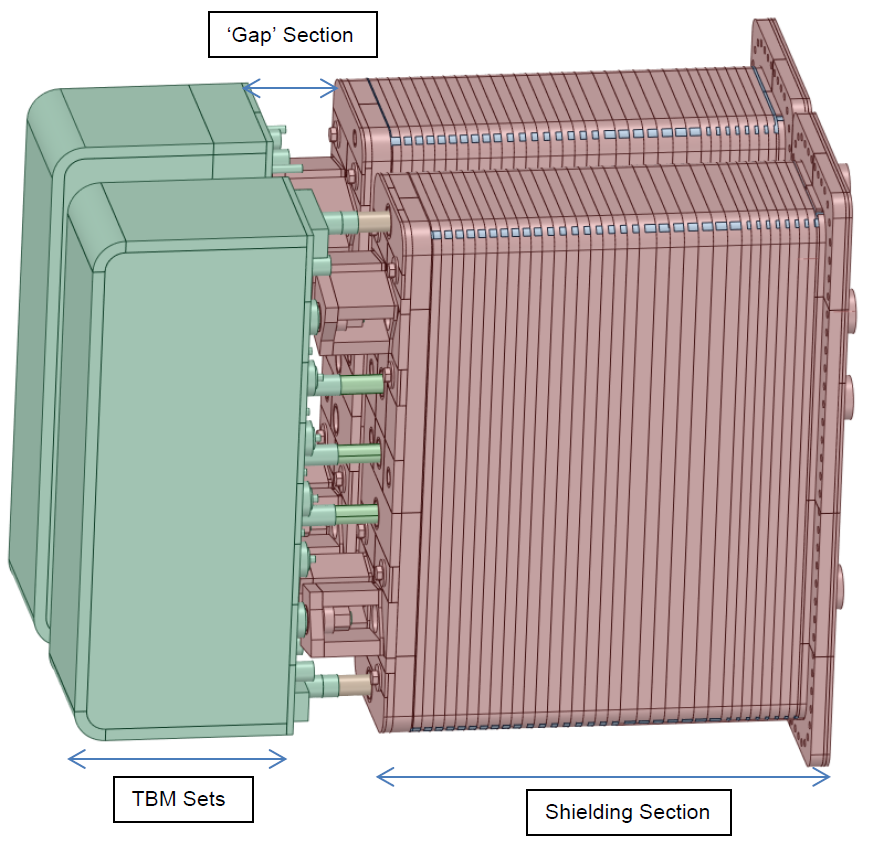
CAD model of the TBM component#
Geometry and run parameters#
The benchmarks are focused on the TBM set (i.e. the actual blanket module) and on the shielding section that can be found behind it. While the shield section does not really change between the two different TBM concepts, the TBM sets do.
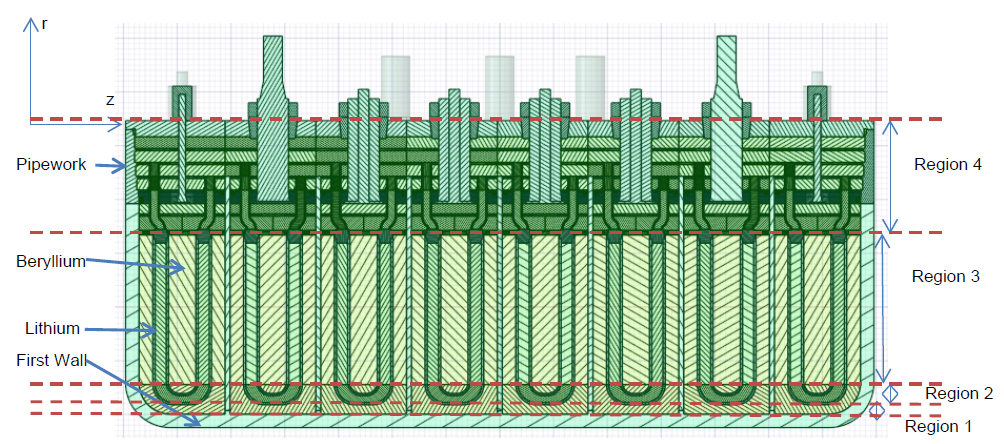
Section of the CAD model of the HCPB TBM set#
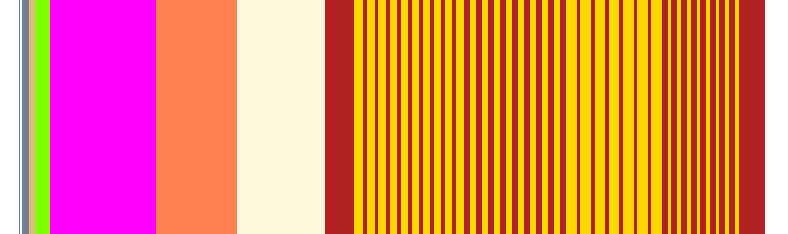
Visualization of the TBM and and shielding section in the 1D MCNP geometry#
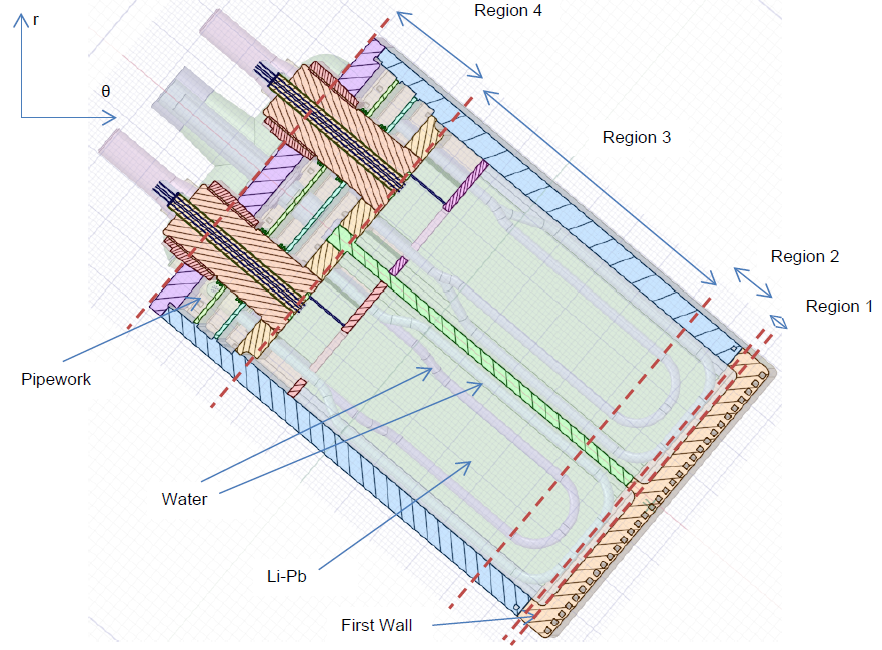
Section of the CAD model of the WCLL TBM set#
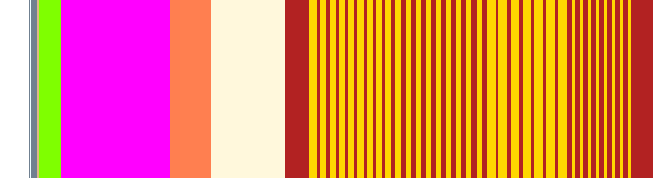
Visualization of the TBM and shielding section in the 1D MCNP geometry#
Tallies#
All Tritium production tallies that were defined for the ITER 1D benchmark were retained also in the TBMs ones. Additionally, a 1-dimensional FMESH was placed on the outboard region (from R=830 up to R=1084.2) composed by 2000 bins. The following quantities were tallied on such grid:
- Tally n. 214
Neutron heating [MeV/cm^3/n_s.
- Tally n. 224
Photon heating [MeV/cm^3/n_s].
- Tally n. 234
Tritium production [atoms/cm^3/n_s].
- Tally n. 244
Neutron flux [#/cm^3/n_s].
- Tally n. 254
Photon flux [#/cm^3/n_s].
See also
Generation of 1D TBM WCLL and HCPB MCNP computational models, F4E IDM [F4E_D_2JMRZR v1.0]
C-Model#
Important
This benchmark input cannot be distributed directly with JADE. The user must request to obtain it from ITER organization.
During the long life of the ITER project, many neutronics models have been generated to represent the TOKAMAK machine. These are used to conduct neutronic analyses on the reactor in order to investigate many direct and indirect effects induced by neutrons like heat generation, particle generation, DPA, dose rate, etc. C-Model is an extremely detailed MCNP input of a 40° sector of ITER TOKAMAK. It was the most complete neutronic model available for the ITER machine until 2021, when E-lite was released which is a full 360° model of ITER that was conceived to overcome some limitation encountered using the C-Model for specific application. Nevertheless, since E-lite is an extremely heavy model, C-model is still considered a valid model to compute the possible impact on the nuclear responses over the ITER machine.
Geometry and run parameters#
C-model R181031. Origin (1050,200,0). Basis (0.982339, 0.187112, 0.000000) (0,0,1). Extent (1000,1000)#
Due to its complexity, a thorough description of the C-Model benchmark geometry is considered out of the scope of this work and can be found, instead, in a dedicated F4E report.
Tallies#
The C-model standard tallies have been used. They include neutron current, neutron flux and nuclear heating at different locations. More precisely:
F11: Neutron current on plasma boundary (inboard BLK#1-6)
F21: Neutron current on plasma boundary (BLK#7)
F31: Neutron current on plasma boundary (BLK#8)
F41: Neutron current on plasma boundary (BLK#9)
F51: Neutron current on plasma boundary (BLK#10)
F61: Neutron current on plasma boundary (BLK#11)
F71: Neutron current on plasma boundary (BLK#12)
F81: Neutron current on plasma boundary (BLK#13)
F91: Neutron current on plasma boundary (BLK#14)
F101: Neutron current on plasma boundary (BLK#15)
F111: Neutron current on plasma boundary (BLK#16)
F121: Neutron current on plasma boundary (BLK#17)
F131: Neutron current on plasma boundary (BLK#18)
F12: Neutron flux on plasma boundary (inboard BLK#1-6)
F22: Neutron flux on plasma boundary (BLK#7)
F32: Neutron flux on plasma boundary (BLK#8)
F42: Neutron flux on plasma boundary (BLK#9)
F52: Neutron flux on plasma boundary (BLK#10)
F62: Neutron flux on plasma boundary (BLK#11)
F72: Neutron flux on plasma boundary (BLK#12)
F82: Neutron flux on plasma boundary (BLK#13)
F92: Neutron flux on plasma boundary (BLK#14)
F102: Neutron flux on plasma boundary (BLK#15)
F112: Neutron flux on plasma boundary (BLK#16)
F122: Neutron flux on plasma boundary (BLK#17)
F132: Neutron flux on plasma boundary (BLK#18)
F16: Nuclear heat in the blanket and divertor
F26: Nuclear heat in the vacuum vessel, port extension and port ducts
F36: Nuclear heat in thermal shields
F46: Nuclear heat in the cryostat
F56: Nuclear heat in port plugs
F66: Nuclear heat in PF coils
F76: Nuclear heat in TF coils
F86: Nuclear heat in correction coils
F96: Nuclear heat in Central solenoid
See also
Related papers and contributions:
D. Leichtle, B. Colling, M. Fabbri, R. Juarez, M. Loughlin, R. Pampin, E. Polunovskiy, A. Serikov, A. Turner and L. Bertalot, 2018, “The ITER tokamak neutronics reference model C-Model”, Fusion Engineering and Design, 136 742-746
R. Juarez, G. Pedroche, M. J. Loughlin, R. Pampin, P Martinez, M. De Pietri, J. Alguacil, F. Ogando, P. Sauvan, A. J. Lopez-Revelles, A. Kolšek, E. Pol-unovskiy, M. Fabbri, and J. Sanz. “A full and heterogeneous model of the ITERtokamak for comprehensive nuclear analyses”. In:Nature Energy 6 (2021), pp. 150–157
E. Polunovskiy. “Description of ITER Nuclear Analysis Tokamak Reference Model C-model R181031”. Technical Report [ITER IDM XETSWC v1.5]. Iter Organization, 2019.
Sphere SDDR#
The Sphere SDDR benchmark is a variation of the the Sphere Leakage which is focused on isotopes activation and dose rate measurement. Once again, these kind of benchmarks allows to test all available isotopes in the library under assessment (this time being a D1S activation library) together with a few typical ITER materials. In particular, each single reaction channel (MT) of every isotope will be tested separately while, for the typical materials, all possible reactions foreseen by the library will be considered.
Geometry and run parameters#
Schematic view of the Sphere SDDR model#
The geometry of the Sphere SDDR benchmarks, is practically the same as the one of the Sphere Leakage benchmark. The only difference is that externally to the filled sphere, a void spherical shell has been defined having a 10 cm radial thickness. This is the cell used to tally the contact shut down dose rate.
Similarly to what was done for the Sphere Leakage benchmark, the user have control on the densities to be applied for each element and material (default is set to NTP conditions with few exceptions) and control on the STOP parameters to be used. The same 0-14 MeV uniform neutron point source is also defined.
In addition to the parameters that can be set for the Sphere Leakage benchmark, the D1S-UNED
irradiation files must also be provided for each activation library that needs to be tested.
These irradiation files contain the D1S time factors related to the SA-2 scenarios (see next paragraph) for all
available daughter nuclides in the library. The file must be named as irrad_<library> where
<library> is the suffix of the activation library the time factor refers to. This should be
the same as the one used in the activationfile. The file must be placed in the same folder
as the MaterialsSettings.csv and the ZaidSettings.csv files.
SDDR parameters#
The cool-down times that have been considered are 0 s, 2.7 h, 24 h, 11.6 d, 30 d and 10 y. For the isotopes simulations, since only one reaction is considered, relative comparisons at different cool-down times will not lead to different results, hence, during post-processing operations only the results at 0 s are elaborated. This does not apply to materials simulations, where many different reactions are included.
The irradiation schedule considered for the Sphere SDDR benchmark is reported hereafter:
Source Intensity [n/s] |
Δt irr. |
Multiplicity |
|---|---|---|
1.0714E+17 |
2 y |
1 |
8.2500E+17 |
10 y |
1 |
0 |
9 m |
1 |
1.6667E+18 |
15 m |
1 |
0 |
3290 s |
-> |
2.0000E+19 |
400 s |
17 |
0 |
3290 s |
-> |
2.8000E+19 |
400 s |
4 |
Note
This scenario does not match exactly the official ITER SA2 irradiation scenario which has only 3 final pulses instead of 4. The results from JADE will be conservative with respect to the official scenario.
As previously discussed, the irradiation file and reaction file provided together with the MCNP input file are generated in two different ways depending on if the simulation is conducted on a single isotope or on a typical ITER material. In the first case, a single reaction is considered and the irradiation file will only contain the daughter of such irradiation. In the second case, all possible reactions that are available in the library and that can be originated in the material will be included. The irradiation file will be then generated accordingly.
Tallies#
All neutron and photon related tallies defined in Sphere Leakage benchmark have also been imported in the Sphere SDDR benchmark. For photons, the time binning necessary to cover all the cool-down times of interest have been added. Tally n. 104 have been also defined to tally the shut down dose rate at all cool-down times in the additional spherical shell added for this specific purpose [Sv/h].
See also
For additional information on SA2 irradiation scenario and ITER irradiation scenarios in general the reader is referred to Loughlin M. and Taylor N., 2009, “Recommendation on Plasma scenarios”, [ITER IDM 2V3V8G v1.2].
ITER CYLINDER SDDR#
The ITER Cylinder SDDR is a very popular computational benchmark for SDDR computation in ITER since it features dimensions, materials and streaming characteristics of a typical ITER equatorial port.
Geometry and run parameters#
ITER Cylinder SDDR benchmark geometry visualization#
The ITER Cylinder SDDR is a simple yet effective benchmark. The model is composed by a 550 cm long, hollowed steel cylinder with internal and external radius respectively equal to 50 cm and 100 cm. The rear part of the cylinder is closed with a steel disk plate of 48 cm radius and 15 cm thick. The inner front part of the cylinder is filled with a smaller cylinder made of a water-steel mixture. This internal 48 cm radius cylinder is 210 cm long and features a central 15 cm diameter cylindrical hole. As it can be deducted from the given measures, a 2 cm gap is left between the main external hollow cylinder and its internal components.
A volumetric and isotropic 14 MeV neutron source is also defined. The volume of emission is a disk aligned with the front part of the cylinder assembly and positioned at a distance of 100 cm. The volume of the disk is 10 cm thick and has a radius equal to 100 cm.
A series of cells and surfaces is also defined for tallying purposes. The shutdown dose rate due to the activation of the assembly is evaluated in cell tallies located 30 cm past the end of the rear plate. The tally cells consist of concentric (hollow) disks which are 10 cm thick and are characterized from the following radii:
from 0 cm to 15 cm (MCNP cell n. 10);
from 15 cm to 30 cm (MCNP cell n. 11);
from 30 cm to 45 cm (MCNP cell n. 12);
from 45 cm to 60 cm (MCNP cell n. 13).
For flux tallying purposes, instead, the following cylindrical surfaces have been defined:
1, coincident with the external surface of the central hole;
2, coincident with the external surface of the water/steel cylinder;
3, coincident with the internal surface of the main steel cylinder;
4, coincident with the external surface of the main steel cylinder;
and the following planes orthogonal to the cylinder length:
22, coincident with the front of the assembly;
23, coincident with the rear of the water/steel cylinder;
24, coincident with the front of the rear plate;
25, coincident with the rear of the assembly.
SDDR parameters#
The irradiation schedule considered for ITER Cylinder SDDR benchmark is reported hereafter:
Source Intensity [n/s] |
Δt irr. |
Multiplicity |
|---|---|---|
1.0714E+17 |
2 y |
1 |
8.2500E+17 |
10 y |
1 |
0 |
9 m |
1 |
1.6667E+18 |
15 m |
1 |
0 |
3290 s |
-> |
2.0000E+19 |
400 s |
17 |
0 |
3290 s |
-> |
2.8000E+19 |
400 s |
4 |
Two different cool-down times were considered in the photon tallies: 0s and 1e6 s (approx. 11.5 days). That is, these are the time interval waited after the irradiation phase has finished before tallying the SDDR and the photon flux.
Note
This scenario does not match exactly the official ITER SA2 irradiation scenario which has only 3 final pulses instead of 4. The results from JADE will be conservative with respect to the official scenario.
The possible reactions considered during the simulation are listed in the following table:
Parent |
Daughter |
|---|---|
Cr50 |
Cr51 |
Cr52 |
Cr51 |
Mn55 |
Mn54 |
Fe54 |
Mn54 |
Fe54 |
Cr51 |
Fe56 |
Mn54 |
Fe58 |
Fe59 |
Co59 |
Co58 |
Co59 |
Co60 |
Co59 |
Fe59 |
Ni58 |
Co58 |
Ni60 |
Co60 |
Ni61 |
Co60 |
Ni61 |
Co60 |
Ni62 |
Fe59 |
Cu63 |
Cu62 |
Cu63 |
Co60 |
Cu65 |
Cu66 |
Ta181 |
Ta182 |
W182 |
Ta182 |
W186 |
W187 |
Tallies#
Neutron flux, (decay) gamma flux and SDDR are the only tallied quantities. The following is a description of the tallies defined in the benchmark:
- Tally n. 202
Neutron flux per energy bin [#/cm^2/s]. The flux is tallied in 16 energy bins ranging between 1E-10 MeV to 20 MeV. The flux is also binned geometrically.
- Tally n. 242
Total neutron flux [#/cm^2/s]. Same as Tally n. 202 but without the energy binning.
- Tally n. 14
Gamma flux per energy bin in cell 10 [#/cm^2/s]. The flux is tallied in 16 energy bins ranging from 0.1 MeV to 20 MeV. The flux is tallied at both cool-down times.
- Tally n. 34
Gamma flux per energy bin in cell 11 [#/cm^2/s]. The flux is tallied in 16 energy bins ranging from 0.1 MeV to 20 MeV. The flux is tallied at both cool-down times.
- Tally n. 44
Gamma flux per energy bin in cell 12 [#/cm^2/s]. The flux is tallied in 16 energy bins ranging from 0.1 MeV to 20 MeV. The flux is tallied at both cool-down times.
- Tally n. 54
Gamma flux per energy bin in cell 13 [#/cm^2/s]. The flux is tallied in 16 energy bins ranging from 0.1 MeV to 20 MeV. The flux is tallied at both cool-down times.
- Tally n. 74
Total gamma flux [#/cm^2/s]. The flux is tallied only by cell (i.e. 10, 11, 12 and 13).
- Tally n. 124
SSDR behind the plate [Sv/h]. The SDDR is computed at all cell tallies (i.e. 10, 11, 12 and 13) and at both cool-down times.
See also
Related papers and contributions
M. Youssef, Feder R., Batistoni P., Fischer U., Jakhar S., Konno C., Lough-lin M., and Villari R. “Benchmarking of the 3-D CAD-based Discrete Ordinates code “ATTILA” for dose rate calculations against experiments and MonteCarlo calculations”. In: Fusion Engineering and Design 88 (2013), pp. 3033–3040.
R. Pampin, A. Davis, J. Izquierdo, D. Leichtle, M.D. Loughlin, J. Sanz, A.Turner, R. Villari, and P.P.H. Wilson. “Developments and needs in nuclearanalysis of fusion technology”. In: Fusion Engineering and Design 88 (2013), pp. 454–460.
Simple Tokamak#
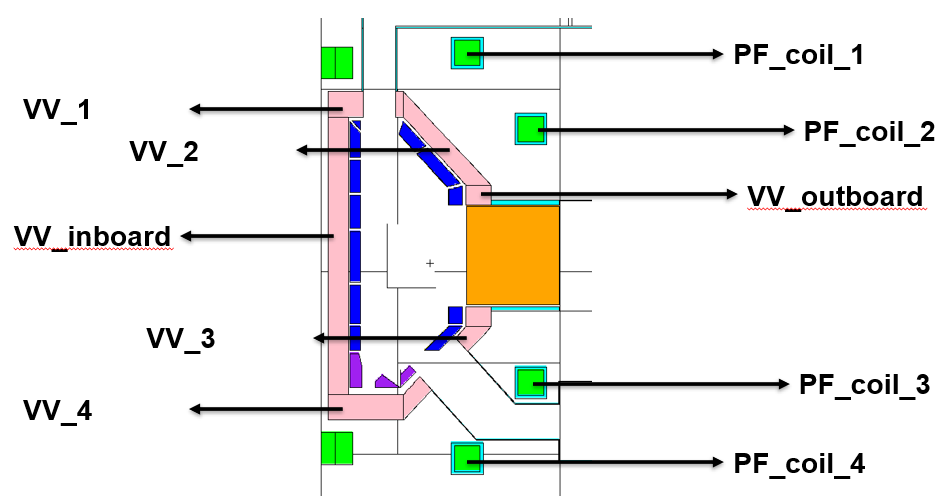
Simple Tokamak geometry (xz)#
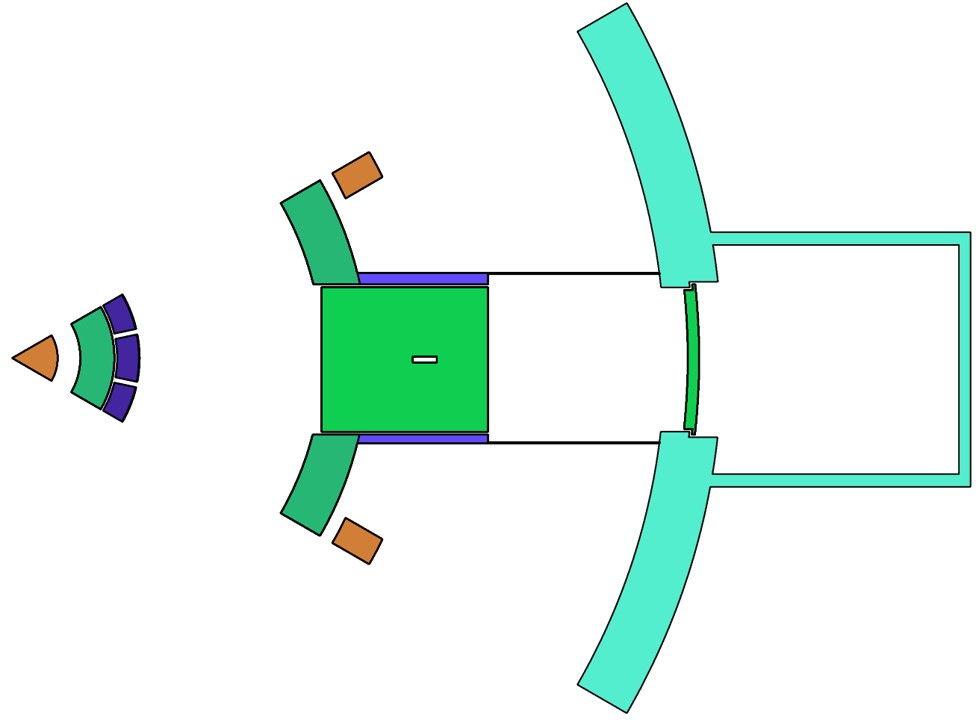
Simple Tokamak geometry (xy)#
The simplified tokamak is a 60 degree model with a representation of the major components of a tokamak. Owing to its simplicity, this model is well suited to transport code benchmarking while being representative of geometry and energy regimes in the nuclear analysis of fusion devices.
Geometry and run parameters#
Reflecting planes are included on the lateral bounds of the sector to approximate the toroidal symmetry of the tokamak. Typical materials for a tokamak are used in a homogenized form for the blanket, divertor, vacuum vessel, ports, toroidal and poloidal field coils and the bioshield. In total, the model has 168 cells, 344 surfaces and 92 nuclides. The source term is an isotropic point source emitting neutrons with an energy of 14 MeV positioned in the center of the plasma region of the geometry. The cells numbers have been labeled arbitrary assigning a more descriptive name for each component. For instance the first number is related to the z coordinates (up or down) as shown in the Figure below, while in the case of the breeding blanket cells the second number depends on the toroidal location (y coordinate).
Tallies#
The following nuclear responses are tallied in this benchmark:
- Tally n. 24
Neutron flux in blanket.
- Tally n. 34
Photon flux in blanket.
- Tally n. 44
Neutron flux in PF coils.
- Tally n.54
Photon flux in PF coils.
- Tally n. 64
Neutron spectrum (binned in Vitamin-J 175 energy groups) in outboard blanket.
- Tally n. 74
Photon spectrum (binned in Vitamin-J 175 energy groups) in outboard blanket.
- Tally n. 84
Neutron spectrum (binned in Vitamin-J 175 energy groups) in PF coils.
- Tally n. 94
Photon spectrum (binned in Vitamin-J 175 energy groups) in PF coils.
- Tally n. 6
Neutron nuclear heating in blanket.
- Tally n. 16
Photon nuclear heating in blanket.
- Tally n. 26
Neutron nuclear heating in PF coils.
- Tally n. 36
Photon nuclear heating in PF coils.
- Tally n. 46
Neutron nuclear heating in VV.
- Tally n. 56
Photon nuclear heating in VV.
- Tally n. 104
Tritium production in blanket.
- Tally n. 114
DPA in divertor cell.