
Experimental Benchmarks#
FNG SDDR Experiment#
The Frascati Neutron Generator (FNG) is an experimental facility designed and built by ENEA (the italian New Technology, Energy and Ambient Body) in Frascati, Italy. The installation is able to produce 14 MeV neutrons based on the T(d,n)α fusion reaction and it is able to produce up to 5E+11 n/s.
One of the key experiments that have been conducted at the FNG is the neutron irradiation experiment, where a mock-up of the outer vacuum vessel region of ITER was irradiated by means of 14 MeV neutrons for a sufficiently long time in order to achieve achieve significative activation levels. Two distinct irradiation campaigns were conducted in May and August 2000 and, among other things, the SDDR values after different cooling time intervals were measured. Many benchmarks activities have been performed using the experiment in the past, and the benchmark is also included in the SINBAD database (listed as fng_dose).
Geometry#
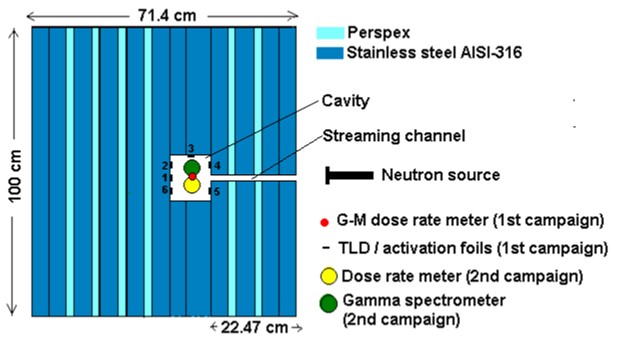
FNG SDDR experiment layout#
At the FNG, a deuterium beam is accelerated up to 300 KeV by means of a linear electro-static tube towards a target rich in tritium generating a 14 MeV neutron source. These are the neutrons that were used to irradiate the experimental assembly which consisted of a block of stainless steel and water equivalent material (perspex) with total thickness of 71.4 cm, and a lateral size of 100 cm x 100 cm. A cavity was obtained within the block (12.6 cm in the beam direction, 11.98 cm high) behind a 22.47 cm thick shield. A void channel (2.7 cm inner diameter) was included in front of the cavity to study the effect of streaming paths in the bulk shield. A squared box was used to locate detectors inside the cavity, with 2 mm thick bottom and lateral walls. Measurements were taken in the cavity, during the irradiation and after shut-down, to obtain the local neutron flux, the decay gamma-ray spectra and the dose rates for different cooling times.
JADE MCNP input template was realized starting from the MCNP inputs provided in the SINBAD database and, for this reason, it cannot be freely distributed together with the JADE source code. Cell and surface card were left untouched as well as the material composition. D1S-UNED specific cards were also added.
SDDR Parameters#
The next two tables describe the equivalent schedules considered for respectively the 1st and 2nd irradiation campaign conducted at the FNG.
Δt [s] |
Δt [min] |
Neutron Intensity [n/s] |
|---|---|---|
19440 |
324 |
2.32E+10 |
61680 |
1028 |
0 |
32940 |
549 |
2.87E+10 |
54840 |
914 |
0 |
15720 |
262 |
1.90E+10 |
6360 |
106 |
0 |
8940 |
149 |
1.36E+10 |
Δt [s] |
Δt [min] |
Neutron Intensity [n/s] |
|---|---|---|
1748 |
29 |
3.04E+10 |
7820 |
130 |
4.28E+10 |
54140 |
902 |
0 |
22140 |
369 |
4.29E+10 |
900 |
15 |
0 |
3820 |
64 |
3.38E+10 |
420 |
7 |
0 |
140 |
2 |
2.86E+10 |
The experimentally measured SDDR values at different cooling times are reported in the next tables for the 1st and 2nd irradiation campaigns.
Cooldown Time [d] |
Cooldown Time [s] |
Experimental SDDR [Sv/h] |
Relative Error |
|---|---|---|---|
1 |
86400 |
2.46E-06 |
0.1 |
7 |
604800 |
6.99E-07 |
0.1 |
15 |
1296000 |
4.95E-07 |
0.1 |
30 |
2592000 |
4.16E-07 |
0.1 |
60 |
5184000 |
3.16E-07 |
0.1 |
Cooldown Time [s] |
Cooldown Time [h] |
Cooldown Time [d] |
Experimental SDDR [Sv/h] |
Relative Error |
|---|---|---|---|---|
4380 |
1.22 |
0.05 |
4.88E-04 |
3.89E-02 |
6180 |
1.72 |
0.07 |
4.15E-04 |
3.86E-02 |
7488 |
2.08 |
0.09 |
3.75E-04 |
4.00E-02 |
11580 |
3.22 |
0.13 |
2.68E-04 |
3.73E-02 |
17280 |
4.80 |
0.20 |
1.73E-04 |
4.05E-02 |
24480 |
6.80 |
0.28 |
1.01E-04 |
3.96E-02 |
34080 |
9.47 |
0.39 |
5.06E-05 |
3.95E-02 |
45780 |
12.72 |
0.53 |
2.30E-05 |
3.91E-02 |
57240 |
15.90 |
0.66 |
1.17E-05 |
4.27E-02 |
72550 |
20.15 |
0.84 |
5.80E-06 |
3.97E-02 |
90720 |
25.20 |
1.05 |
3.56E-06 |
3.93E-02 |
132000 |
36.67 |
1.53 |
2.43E-06 |
3.70E-02 |
212400 |
59.00 |
2.46 |
1.78E-06 |
3.93E-02 |
345600 |
96.00 |
4.00 |
1.22E-06 |
4.10E-02 |
479300 |
133.14 |
5.55 |
9.52E-07 |
3.89E-02 |
708500 |
196.81 |
8.20 |
7.59E-07 |
3.95E-02 |
1050000 |
291.67 |
12.15 |
6.67E-07 |
3.90E-02 |
1670000 |
463.89 |
19.33 |
6.13E-07 |
3.92E-02 |
1710000 |
475.00 |
19.79 |
6.14E-07 |
3.91E-02 |
When simulating with the D1S approach, in order to reduce the computation time it is good practice to individuate the subset of decay isotopes which contribute the most to the dose rate. This subset will depend from the unirradiated material composition and the cool-down time that are considered. In order to do so, preliminary activation calculation are usually performed with the help of activation codes like FISPACT or ACAB. These studies have been already conducted both during the D1S libraries initial V&V procedure and when the experimental results were tested for the first time. The next plot lists the isotopes contributing cumulatively to more than 95% of the dose rate during the first irradiation campaign.
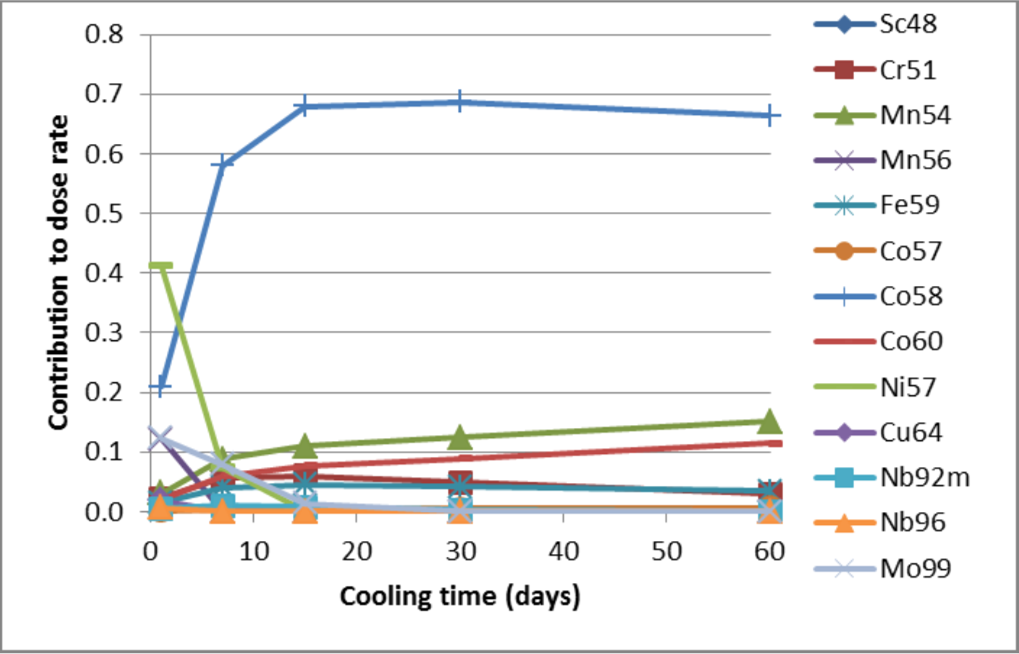
Isotope contribution to the the dose during the first FNG irradiation campaign#
At this point, the D1S reaction file can be generated: it will include all reactions that can originate in the material (i.e. that are also available in the activation library) which result in the creation of one of the daughters of interest. The D1S irradiation file will simply contain those daughters which are generated by at least one reaction. All of this implies that a comparison between two different libraries can often not be an exact one. Indeed, it is quite common that to a new library release corresponds an increase in the number of available reactions. Nevertheless, this is in line with the philosophy of JADE. If the Sphere benchmarks are the primary tools that should be used to identify specific inconsistencies at the single cross section level among libraries, all other benchmarks have a slightly different scope which is to show how big is the impact of these inconsistencies on more realistic applications.
Tallies#
The only tallied result for the FNG benchmark is the dose rate at the dosimeter location inside the cavity (tally n.4).
See also
Related papers:
M. Martone, M. Angelone, and M. Pillon. “The 14 MeV Frascati neutron generator”. In: Journal of Nuclear Materials 212-215 (1994). Fusion Reactor Materials, pp. 1661–1664
P. Batistoni, M. Angelone, L. Petrizzi, and M. Pillon. “Benchmark Experiment for the Validation of Shut Down Activation and Dose Rate in a Fusion Device”. In: Journal of Nuclear Science and Technology 39.sup2 (2002), pp. 974–977.
K. Seidel, Y. Chen, U. Fischer, H. Freiesleben, D. Richter, and S. Unholzer.“Measurement and analysis of dose rates and gamma-ray fluxes in an ITER shut-down dose rate experiment”. In:Fusion Engineering and Design 63-64 (2002), pp. 211–215.
R. Pampin, A. Davis, R.A. Forrest, D.A. Barnett, I. Davis, and M.Z. Youssef.“Status of novel tools for estimation of activation dose”. In: Fusion Engineering and Design 85.10 (2010). Proceedings of the Ninth International Symposiumon Fusion Nuclear Technology, pp. 2080–2085.
J. Sanz, O. Cabellos, and N. Garcia-Herranz. Inventory Code for Nuclear Applications: User’s Manual V. 2008. RSICC. 2008.
FNG Bulk Blanket and Shield Experiment#
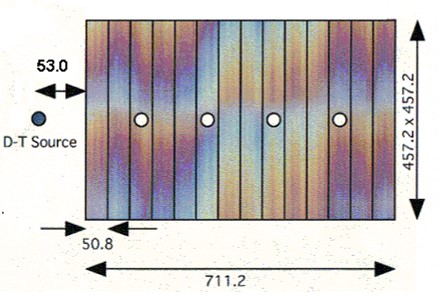
The aim of the experiment is to carry out a series of neutronics measurements, using 14 MeV neutrons, on a mockup of ITER inboard shielding system, with the purpose of validating the ITER shielding blanket design. To achieve the objective, mockup assembly configuration and material composition were chosen so that to replicate those of the ITER shielding system at the inboard side. The experiment was carried out at FNG facility, described in FNG SDDR Experiment, in the years 1995-97.
Geometry and run parameters#
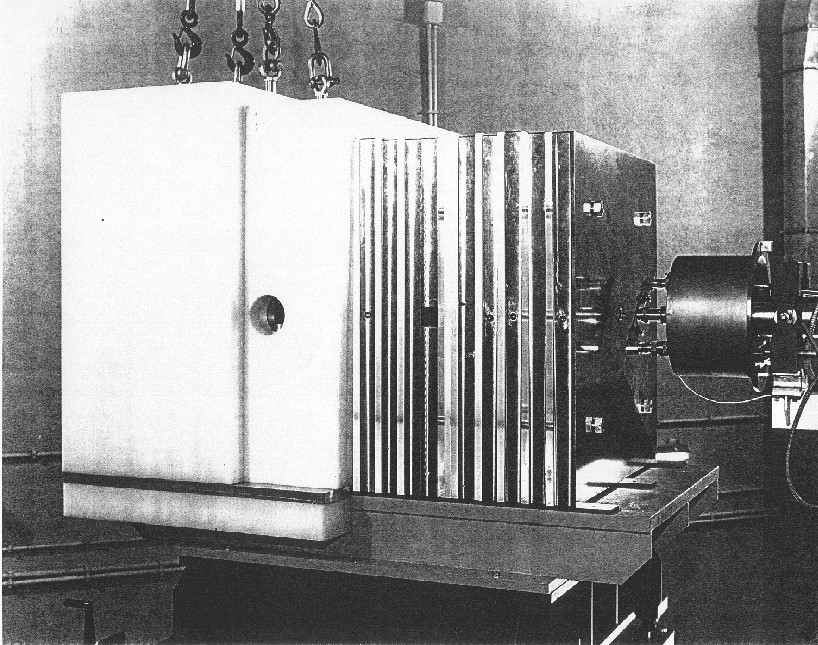
Photo of ITER Bulk Blanket mockup assembly.#
The shield mockup is shown in the figure above. It consists of:
A 1 cm thick layer of copper simulating the first wall (FW),
A shielding block made of stainless steel AISI 316 type (SS) plates and Perspex (a water equivalent material). The plates are arranged in such a way as to reproduce blanket and vacuum vessel (VV) segment, including the manifold region and the backplate,
A block made of alternate plates of SS316 and Cu (both with thickness 2.2 cm), attached behind the shielding block, simulating ITER Toroidal Field Coils (TFC).
The block is located at 5.3 cm from the neutron source. Of these 5.3 cm, 5 cm are in air and the remaining 0.3 cm are due to the target support structure ( 1 mm Cu, 1 mm H2O, and 1 mm SS). The block is positioned over an aluminium support and is surrounded by bunker walls. The mockup is shielded in the rear side by a Polyethylene shield, to reduce to negligible levels the radiation backscattered from the bunker walls, with respect to the direct penetration flux.
In the experiment, activation foils were located in different locations along the block central (horizontal) axis, at different penetration depths. Only foils of the same material were irradiated during every single irradiation. Soon after each irradiation, the foils activities were recorded by a set of calibrated HPGe detectors.
Tallies#
The source angle/energy distribution was calculated with MCNP, taking into account the reaction kinematics and the slowing down of beam deuterons in the tritium/titanium target. Only one tally is defined for each input:
- Tally n. 4
A track length flux tally has been used to collect results in the cells corresponding to the activation foils in MCNP geometry. The tally has been multiplied in each input (with FM card) by the appropriate microscopic reaction cross section, to obtain results in terms of number of reactions per unit neutron from the source. No energy bins were used. Nuclear data for tally collection was taken from IRDFF dosimetry libraries. In the following, a list of the reactions considered for each activation foil material is reported:
Nb-93(n,2n)Nb-92
Ni-58(n,2n)Ni-57
Ni-58(n,p)Co-58
Fe-56(n,p)Mn-56
Al-27(n,a)Na-24
In-115(n,n’)In-115m
Mn-55(n,g)Mn-56
Au-197(n,g)Au-198
See also
Related papers and contributions:
Batistoni, M. Angelone, W. Daenner, U. Fischer, L. Petrizzi, M. Pillon, A. santamarina, K. Seidel, “Neutronics Shield Experiment for ITER at the Frascati Neutron Generator FNG”, 17th Symposium on Fusion Technology, Lisboa, Portugal, September 16-20, 1996.
FNG Benchmark Experiment on Tungsten#
The experiment was carried out in 2001 at FNG facility. The purpose is to validate tungsten cross sections as it is a candidate material for high flux components in ITER and its development is pursued in the European Fusion Technology Program. The experiment was carried out with the 14 MeV neutrons source used at FNG described in FNG SDDR Experiment and FNG Bulk Blanket and Shield Experiment.
Geometry and run parameters#
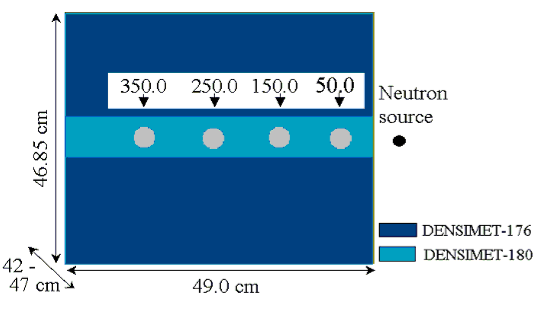
Layout of Benchmark Experiment on Tungsten.#
The geometry of the mock-up consisted of a block of a tungsten alloy, DENSIMET, produced by PLANSEE, in pieces of various shapes. The mock-up is assembled to obtain a size of about 42-47 cm (L) x 46.85 cm (H) and 49 cm in thickness. It was located in front of the FNG target, 5.3 cm from the neutron source. Most of the material (about 1.5 ton) is DENSIMET-176 type (92.3% W, 2.6% Fe, 4.2% Ni). A layer of DENSIMET-180 (about 0.25 ton, 7 cm height, composition 95.0% W, 1.6% Fe, 3.4% Ni) was used in the central part of the block where the measurements were done and contains the lateral access channels (diameter 5.2 cm) for locating detectors of various types (activation foils, TLD holders, active spectrometers)
The neutron reaction rates were measured by activation foils. Eight different reactions, listed in the following section, were used to derive the neutron flux. The reaction rates were measured in four experimental positions at different depths from the block surface, using absolutely calibrated HPGe detectors. During the activation foil measurements, the lateral access channels were completely closed by means of 4 ad hoc cylinders made of DENSIMET – 180, a thin slot was realised (4.4 mm) to locate activation foils in position, using a thin Al holder. The foils were irradiated in three irradiations: in the first one Zr, Al and Mn foils were irradiated; in the second one Nb, Ni and Au foils were irradiated and in the last one Fe and In foils were irradiated.
Tallies#
The source angle/energy distribution was calculated with MCNP, taking into account the reaction kinematics and the slowing down of beam deuterons in the tritium/titanium target. Only one tally is defined for each input:
- Tally n. 4
A track length flux tally has been used to collect results in the cells corresponding to the activation foils in MCNP geometry. The tally has been multiplied in each input (with FM card) by the appropriate microscopic reaction cross section, to obtain results in terms of number of reactions per unit neutron from the source. No energy bins were used. Nuclear data for tally collection was taken from IRDFF dosimetry libraries. In the following, a list of the reactions considered for each activation foil material is reported:
Nb-93(n,2n)Nb-92
Ni-58(n,2n)Ni-57
Ni-58(n,p)Co-58
Fe-56(n,p)Mn-56
Al-27(n,a)Na-24
In-115(n,n’)In-115m
Mn-55(n,g)Mn-56
Au-197(n,g)Au-198
Zr-90(n,2n)Zr-89
See also
Related papers and contributions:
P. Batistoni, M. Angelone, L. Petrizzi, M. Pillon, Measurements and Analysis of Neutron Reaction Rates and of Gamma Heating in Tungsten, MA-NE-R-003, ENEA, Dec. 2002
FNG Silicon Carbide (FNG SiC)#
The purpose of this experiment is to validate Si and C cross sections through irradiation of a monolithic sintered SiC block placed in front of the FNG source. This is in important structural material that is being explored for several different fusion concepts. The experiment was carried out at the FNG facility, described in FNG SDDR Experiment, in 2001.
Geometry#
The SiC mock-up assembly consisted of a sintered SiC block of dimensions 45.72 cm x 45.72 cm x 71.12 cm located 5.3 cm from the FNG source.
Layout of FNG-SiC experiment. Figure taken from the SINBAD repository.#
Measured data#
Four experimental locations were used through the centre of the mock used to measure reaction rates and nuclear heating at different depths:
Reaction rates: 197Au(n,g), 58Ni(n,p), 27Al(n,a), 93Nb(n,2n) at depths of 10.41, 25.65, 40.89 and 56.13 cm from the block surface.
Nuclear heating: Combined neutron and photon heating measured using TLDs at depths of 14.99, 30.23, 45.47 and 60.71 cm.
Important
There was a lack of reliable data on the concentration of boron in the SiC matrix therefore it is recommended that data related to thermal interactions are used in relative comparison only between codes and cross section libraries. This includes the nuclear heating measurements and 197Au(n,g) reaction rate.
MCNP model#
There are two independent MCNP models in order to capture the geometry of the TLD detectors. In both cases the most recently developed SDEF source from ENEA has been used and weight windows are included in each input file.
Further modifications necessary to the distributed input file are captured in the patch file.
MCNP tallies#
The total dose in the TLDs is calculated by summation of the neutron and photon dose. The neutron dose has an associated sensitivity coefficient that varies as a function of depth. The total dose is then calculated as:
Dt= Dn* Kn+ Dg
where Knis the neutron sensitivity coefficient, Dn, the neutron dose and Dg, the photon dose.
Neutron and photon energy deposition are calculated through F6 type tallies. Here, Tally n.16 is used for the neutron energy deposition and Tally n. 26 for photon energy deposition.
JADE post processes the tally results by multiplying by J/MeV=1.602E-13 and g/kg=1000 to give a direct
comparison to the experimental data given in Gy/source neutron.
Reaction rates were calculated using an F4 type tally - Tally n.4 is used in all cases. The reaction MT numbers are by default assigned using the convention for IRDFF-II. The raw output from MCNP can be compared directly the reported measured data.
Patch file#
Coming soon…
See also
Related papers and contributions:
Angelone, M., Batistoni, P., Kodeli, I., Petrizzi, L., Pillon, M., Benchmark analysis of neutronics performances of a SIC block irradiated with 14 MeV neutrons, Fusion Engineering and Design, 63-64, 2002.
FNG Helium Cooled Pebble Bed (HCPB) Tritium Breeder Module (TBM) Mock-up#
The purpose of this experiment was to validate transport through a mock-up of the Helium Cooled Pebble Bed (HCPB) blanket concept. This is one of the concepts anticipated for the ITER test blanket module (TBM) programme and in future fusion power plants. The accurate prediction of the tritium production, one of the primary functions of the blanket is therefore very important. The experiment was carried out at the FNG facility, described in FNG SDDR Experiment, in 2005.
Geometry#
The geometry of the mock-up has external dimensions of 31.0 cm x 29.0 cm x 30.9 cm. The bulk of the geometry consists of beryllium with two layers symmetric across the central plane consisting of Li2CO3 containing natural Li. Stacks of 12 pellets of Li2CO3 encased in Al were assembled for measuring the tritium production rate. At the rear is a steel box filled with Li2CO3.
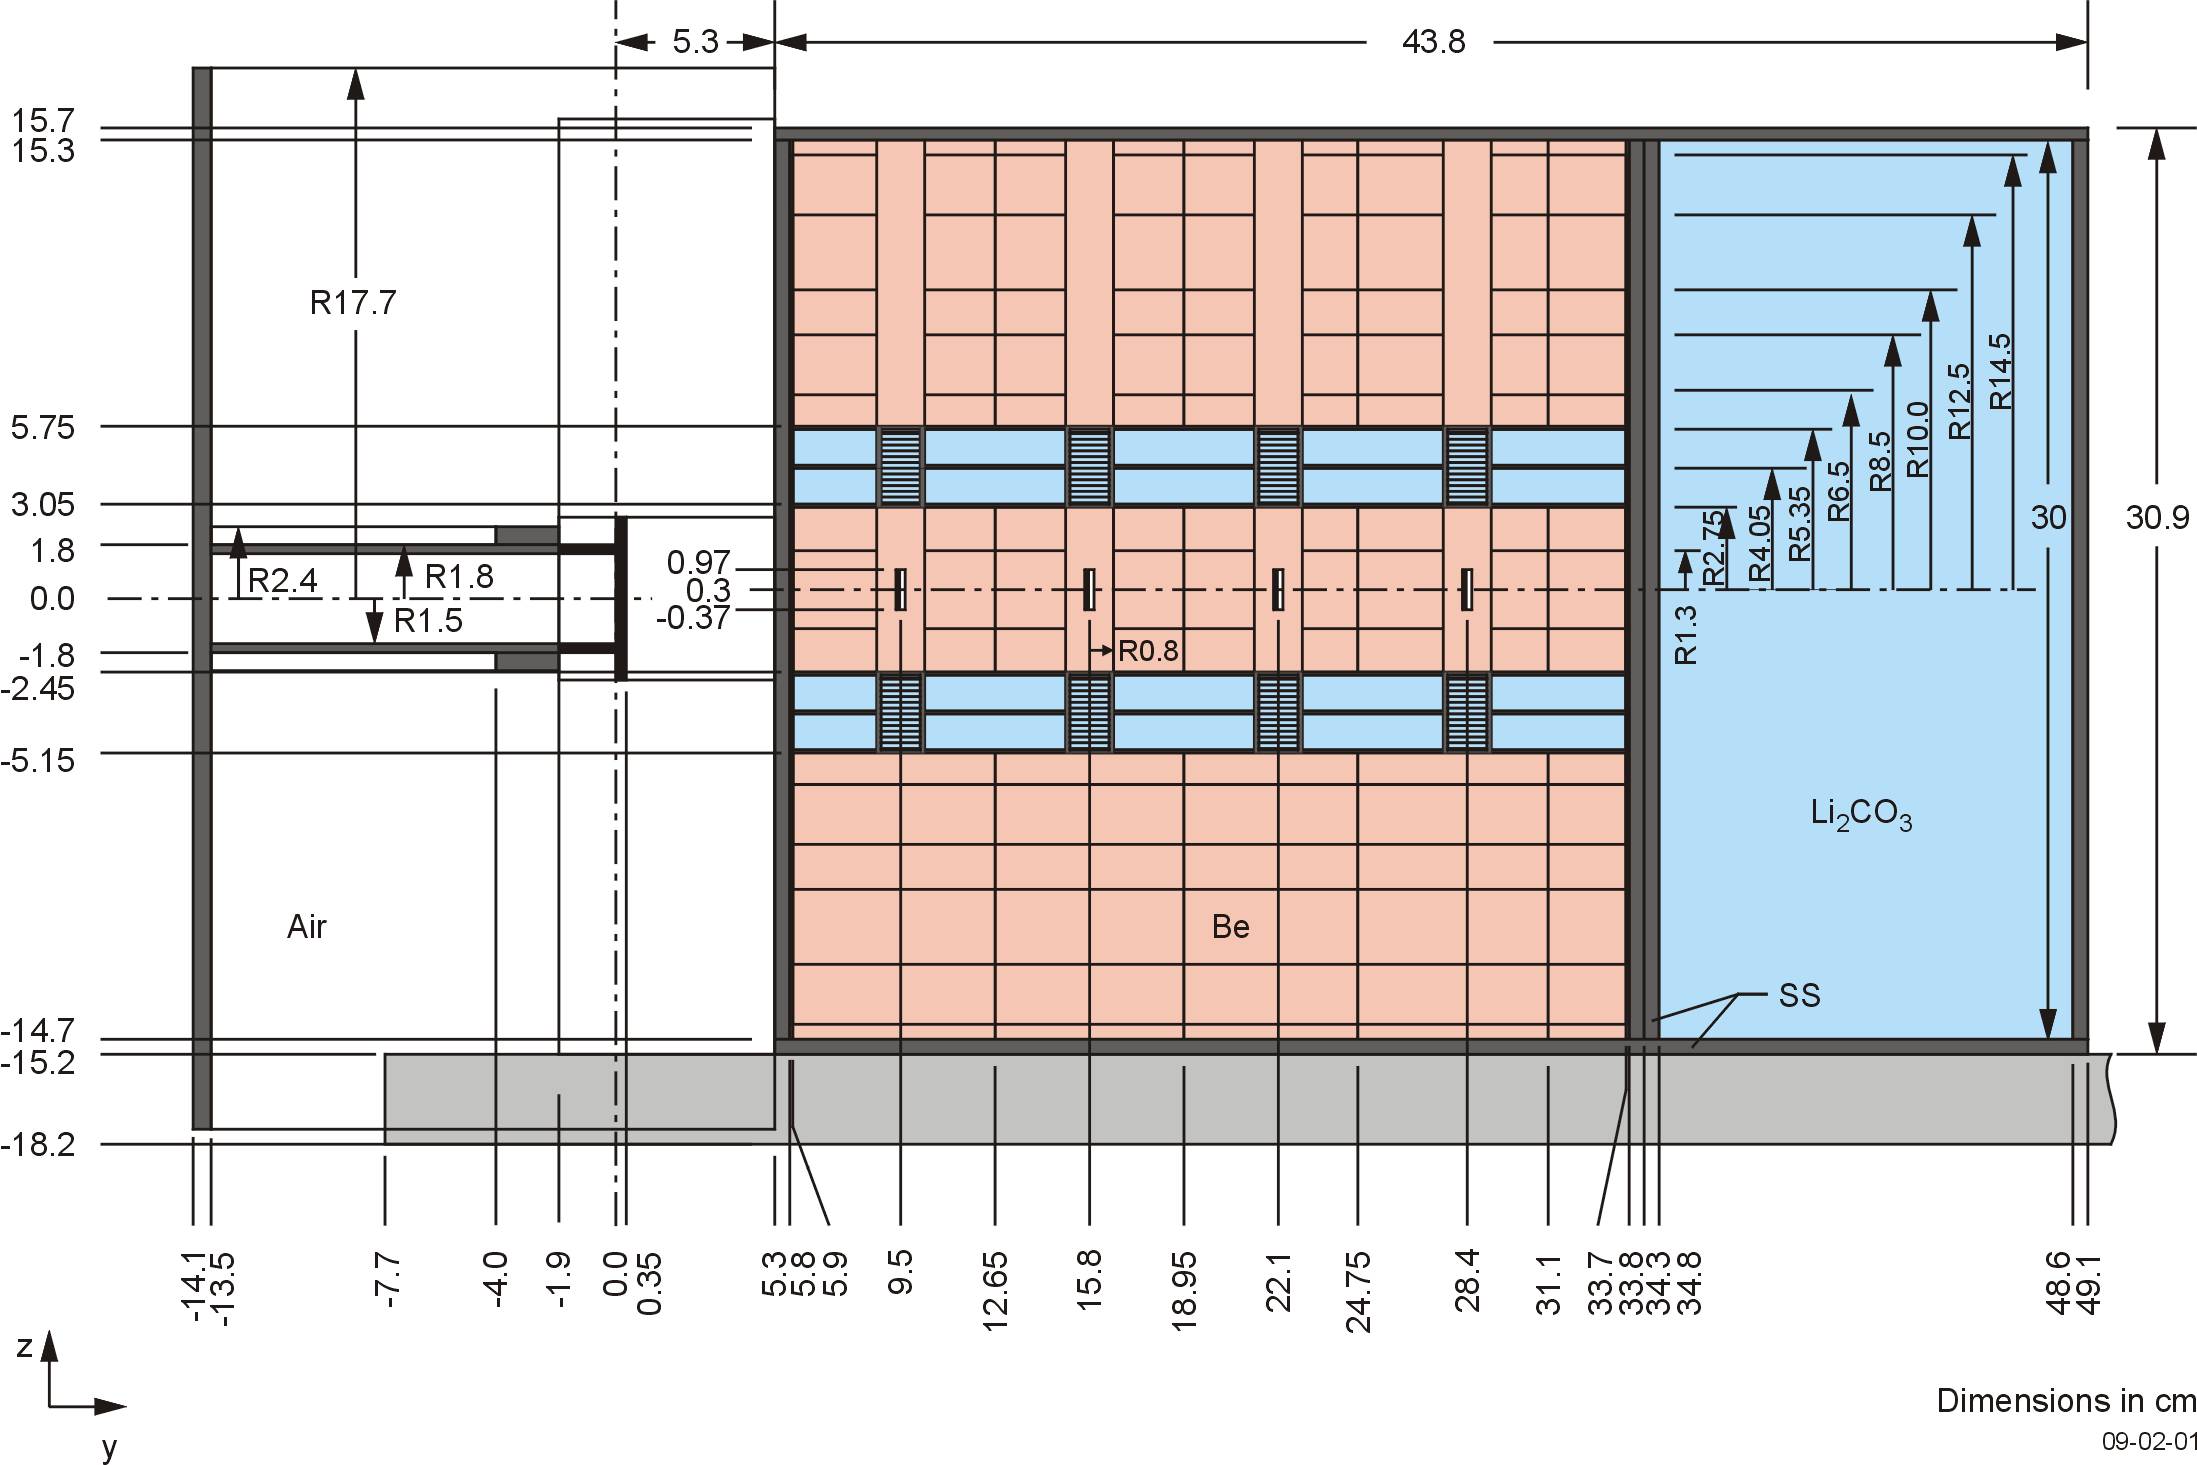
Layout of the FNG-HCPB experiment. [Reference 3]#
Measured data#
Activation foils were placed at increasing distance from the source through the centre of the geometry to measure reaction rates. The tritium production rate was measured at four different depths a the locations of each of the pellet stacks above and below the central axis.
Reaction rates: 197Au(n,g), 58Ni(n,p), 27Al(n,a), 93Nb(n,2n) at depths of 4.055, 10.355, 16.655 and 22.955 cm from the front block surface. There is an additional measurement at depth 0 cm for 93Nb(n,2n).
Tritium Activity: Measured for each of the stacks of 12 pellets as shown in the above Figure. The tritium specific activity is available in units of Bq/g.
The naming convention for each of the sets of the four stacks below the central axis is ENEA2, ENEA4, ENEA6 and ENEA8 corresponding to increasing distance from the source. The pellets are numbered 1 to 12, corresponding to decreasing z, with pellet 1 closest to the central axis.
MCNP model#
The most recently developed SDEF source from ENEA has been used and a weight window is included in the input file.
All modifications necessary to the distributed input file are captured in a patch file.
MCNP tallies#
The reaction rates are calculated using the F4 tally in MCNP and can be directly compared to the experimental data set which are presented per source neutron. Tally n.4 is used in all cases. The reaction MT numbers are by default assigned using the convention for IRDFF-II. The raw output from MCNP can be compared directly the reported measured data.
The tritium production is tallied using the reaction MT number 205 for total triton production in each of the pellets. No energy binning is required. The specific activity is then calculated as:
where \({\lambda}\) is the decay constant, \(n_{tot}\) is the total neutron production and the mass is for an individual pellet. This normalisation is included in the MCNP input file so the raw output can be directly compared to the measured data.
OpenMC model#
To allow for the simulation to run in OpenMC, vacuum boundary conditions were set for all outer surfaces of the geometry.
OpenMC tallies#
The reaction rates are calcaulated using a flux tally and an EnergyFunctionFilter, corresponding to the cross-section data for the nuclide being tallied over. To make the results comparable to the experimental data, the raw output from OpenMC must be divided by the volume of the foils.
The tritium production was tallied using the (n,Xt) score in OpenMC. The specific activity is then calculated in the same way as for MCNP, but factors have to be folded in during post-processing.
Patch file#
Coming soon…
See also
Related papers and contributions:
Batistoni, P., Villari, R., TBM - HCPB Neutronics Experiments: Comparison and Check Consistency among Results Obtained by the Different Teams Implications for ITER TBM Nuclear Design and Final Assessment, FUS-TEC–MA–NE-R-019, ENEA, Dec. 2006.
Batistoni, P., Carconi, P., Villari, R., Angelone, M., Pillon, M., Zappa, G., Measurements and Analysis of Tritium Production Rate (TPR) in Ceramic Breeder and of Neutron Flux by Activation Rates in Beryllium in TBM Mock-up, FUS-TEC-MA-NE-R-014, Dec. 2005.
Kodeli, I, SINBAD database - ongoing activities, ANS, Volume 120, 2019.
FNG Stainless Steel (FNG SS)#
The purpose of this benchmark was to improve understanding of neutron transport in structural materials, specifically, stainless steel. This is a common material for many components in a fusion device. The experiment was carried out at the FNG facility, described in FNG SDDR Experiment, in 1989.
Geometry#
A block of AISI 316 type stainless steel measuring 100 cm x 100 cm x 70 cm was placed 5.3 cm from the FNG source. The assembly can be seen below.
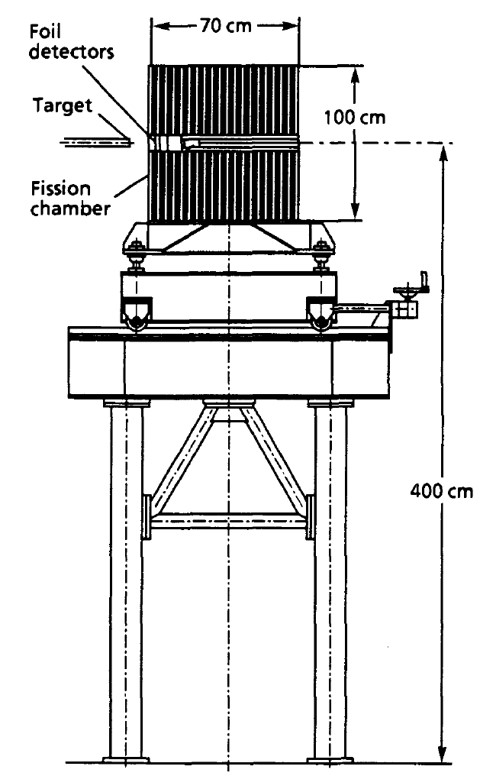
Layout of FNG-SS experiment. [Reference 1]#
Measured data#
Activation foils were placed at different depths through the stainless steel. Only foils of the same material were irradiation in a single irradiation. Foil activities were then determined using HPGe detectors and standard radiometric techniques.
Reaction rates: 58Ni(n,p), 56Fe(n,p) at depths of 4.95, 10.05, 20.15, 30.30, 40.50, 50.70 and 60.90 cm. 27Al(n,a) at 4.95, 10.05, 20.15, 30.30, 40.50, 50.70 and 55.90 cm. 115In(n,n’) at 4.95, 10.05, 20.15, 30.30, 40.50, 50.60 and 60.90 cm. 197Au(n,g), 55Mn(n,g) were measured at 5.0, 10.0, 20.0, 30.0, 40.0, 50.0 and 60.0 cm. 58Ni(n,2n) was measured at 4.95, 10.05, 20.15 and 30.30 cm. All measurements are from the front surface of the assembly.
MCNP model#
The MCNP model includes the source, SS assembly and shielding wall around the facility. Different foils have different thicknesses which also varies with depth therefore 7 independent MCNP models were created for calculating each of the reactions above.
The ENEA SDEF source has been included as for FNG SiC and FNG HCPB models in JADE. No variance reduction is used in this benchmark.
Further modifications necessary to the distributed input file are captured in the patch file.
MCNP tallies#
Reaction rates for each of the different foils in the experiment have been calculated using an F4 tally. Tally n.4 is used in all cases. The reaction MT numbers are by default assigned using the convention for IRDFF-II. The raw output from MCNP can be compared directly the reported measured data available in SINBAD which is given in units of 1024/(source neutron).
OpenMC model#
To prevent OpenMC from returning an error, vacuum boundary conditions were set for the outermost surfaces of the facility housing. The geometry definition of the water funnel (cells 10, 11, 12 and 15) had to be altered due to limitations with OpenMC. Only double-sided cones can be defined in OpenMC, therefore each cone definition has to be coupled with a plane in order to split the cone at its apex.
OpenMC tallies#
The reaction rates are calculated using a flux tally, paired with an openmc.EnergyFunctionFilter for the nuclide in question. The raw output from OpenMC must be divided by the foil volumes in order to give fair comparison to the reported measured data.
Patch file#
Coming soon…
See also
Related papers and contributions:
Martone, M., Angelone, M., Batistoni, P., Pillon, M., Rado, V., FENDL Neutronics Benchmark: Stainless Steel Bulk Shield Experiment Perfomed at Frascati Neutron Generator, INDC(NDS)-315, 1994.
TUD Spectra Measurements (FNG Bulk Shield)#
The purpose of the experiment is the determination of neutron and photon spectra in a neutronic mock-up of the ITER shielding system, irradiated with 14-MeV neutrons.
The same experimental setup used in FNG Bulk Blanket and Shield Experiment was used
Geometry and run parameters#
Neutron and photon spectra were determined in the mock-up on the central axis of the assembly at two positions:
- Position A: Measurement behind the 6 cm thick Perspex layer inside a SS316
slab, at a total penetration depth 41.5 cm from the front of the assembly (Cu 1 cm, SS316 26.08 cm, and Perspex 14.42 cm).
- Position B: Measurement in a SS316 layer at the total penetration depth
87.6 cm from the front of the assembly (Cu 1 cm, SS316 59.82 cm, and Perspex 26.78 cm).
The detectors were placed on the axis of the d-beam of the neutron generator. A NE213 scintillator was employed for simultaneously measuring the neutron spectra for energies E>1 MeV and the photon spectra for energies E>0.2 MeV. For each registered event both the pulse-height and a pulse-shape parameter were recorded to distinguish between neutrons and photons. Pulse-height distributions from three different hydrogen-filled proportional detectors, one methane-filled proportional detector and a stilbene scintillator were used for determining the neutron flux spectra for energies ranging from 20 keV up to about 3.6 MeV, overlapping with the NE213 spectra.
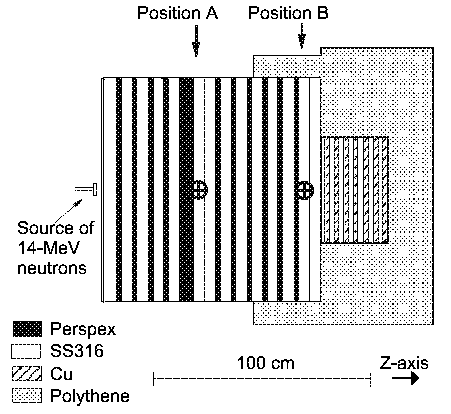
Photo of ITER Bulk Blanket mockup assembly with detectors’ positions.#
Tallies#
A MCNP model of the experimental assembly with the two detectors has been used, with track length flux type 4 tally for both neutron and photons:
- Tally n. 504
This track length flux tally has been used to collect the energy-binned neutron fluence at detector position A
- Tally n. 514
This track length flux tally has been used to collect the energy-binned photon fluence at detector position A
- Tally n. 524
This track length flux tally has been used to collect the energy-binned neutron fluence at detector position B
- Tally n. 534
This track length flux tally has been used to collect the energy-binned photon fluence at detector position B
No FM card was used as the experimental results were given per unit source neutron. During the post-processing the value in each energy bin is divided by the bin width so that to obtain the spectral fluence to be compared with experimental data from the detectors.
See also
Related papers and contributions:
M. Martone, M. Angelone, M. Pillon, The 14 MeV Frascati Neutron Generator, Journal of Nuclear Materials 212-215 (1994) 1661-1664;
M. Pillon, M. Angelone, A. V. Krasilnikov, 14 MeV Neutron Spectra Measurements with 4% Energy Resolution using Type IIa Diamond Detector, Nucl. Instr. Meth. in Phys. Res. B101 (1995) 473-485.
H. Freiesleben, W. Hansen, D. Richter, K. Seidel, S. Unholzer, P. Batistoni, M. Pillon, M. Angelone, Investigation of Neutron and Gamma-ray Spectra in a Blanket Mock-up of the International Thermonuclear Experimental Reactor (ITER), Proc. of the 9th Intern. Symp. on Reactor Dosimetry, Prague, Czech Republic, 2-6 September 1996, Editors: H. Ait Abderrahim, P. D’hondt and B. Osmera, World Scientific, Singapore, 1998, p. 391-396.
H. Freiesleben, W. Hansen, D. Richter, K. Seidel, S. Unholzer, U. Fischer, Y. Wu, M. Angelone, P. Batistoni, M. Pillon, Measurement and Analysis of Spectral Neutron and Photon Fluxes in an ITER Shield Mock-Up, Fusion Technology 1996, Proc. of the 19th. Symp. on Fusion Technology, Lisbon, Portugal, 16-20 September 1996, C. Varandas and F. Serra (editors), Elsevier Science B.V., Amsterdam, 1997, p. 1571-1574.
H. Freiesleben, W. Hansen, D. Richter, K. Seidel, S. Unholzer, U. Fischer, Y. Wu, M. Angelone, P. Batistoni, M. Pillon, Measurement of Neutron and Gamma Spectral Fluxes in the Shielding Assembly, Report TU Dresden, Institut fuer Kern- und Teilchenphysik, TUD-IKTP/96-04, November 1996.
H. Freiesleben, W. Hansen, D. Richter, K. Seidel, S. Unholzer, U. Fischer, Y. Wu, M. Angelone, P. Batistoni, M. Pillon, Neutron and Photon Flux Spectra in a Mock-up of the ITER Shielding System, Fusion Engineering and Design 42 (1998), Proc. of the Fourth Intern. Symp. on Fusion Nuclear Technology, Tokyo, April 6-11, 1997, M.A. Abdou (Ed.), Elsevier Science B.V., Part C, p. 247-253.
U. Fischer, H. Freiesleben, W. Hansen, D. Richter, K. Seidel, S. Unholzer, Y. Wu, Test of evaluated data from libraries for fusion applications in an ITER shield mock-up experiment, International Conference on Nuclear Data for Science and Technology, Trieste, May 19-24, 1997, Conference Proceedings Vol. 59, p. 1215-1217, G. Reffo, A. Ventura and C. Grandi (Eds.), SIF, Bologna, 1997.
M. Tichy, The DIFBAS Program - Description and User’s Guide, Report PTB-7.2- 193-1, Braunschweig 1993.
U. Fischer, Y. Wu, W. Hansen, D. Richter, K. Seidel, S. Unholzer, Benchmark Analyses for the ITER Bulk Shield Experiment with EFF-3.0, -3.1 and FENDL-1, -2 Nuclear Cross-Section Data, IAEA FENDL-2 Consultants’ Meeting, October 12-14, 1998, Vienna.
I. Kodeli, Report on 1999 Activity on ND-1.2.1 (extracts), EFF/DOC-698, EFF Meeting, Issy-les-Moulineaux NEA-DB (Nov. 1999)
P. Batistoni, M. Angelone, U. Fischer, H. Freiesleben, W. Hansen, M. Pillon, L. Petrizzi, D. Richter, K. Seidel, S. Unterholzer: Neutronics Experiment on a Mock-up of the ITER Shielding Blanket at the Frascati Neutron Generator, Fusion Engineering Design 47 (1999) 25-60
A. Milocco, The Quality Assessment of the FNG/TUD Benchmark Experiments, IJS-DP-10216, April 2009
FNG/TUD Tungsten Experiment#
The purpose of the experiment is transport data benchmark by determination of spectral neutron flux and spectral photon flux at four positions in a thick block of W irradiated with 14 MeV neutrons.
The same experimental setup used in FNG Benchmark Experiment on Tungsten was used
Geometry and run parameters#
Neutron and photon flux spectra were measured on the central axis of the assembly in four positions (P1,…,P4) at z = 5, 15, 25 and 35 cm:
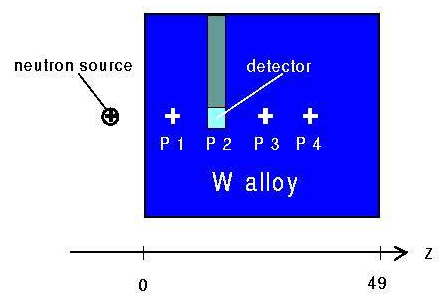
Neutron and photon pulse-height spectra were measured simultaneously using an NE 213 scintillation spectrometer. The dimensions of the cylindrical active volume of the detector were 3.8 cm in both height and diameter. Its material had a mass density of 0.874 g/cm3 and an elemental composition of 54.8 at-% H and 45.2 at-% C. The scintillator was coupled to a photomultiplier by means of a 50 cm long light guide. When the detector was located at one of the positions, the other ones were filled with rods of W alloy.
Tallies#
The calculations were performed taking into account the precise geometry of the mock-up as well as the complete surroundings, to model correctly each measurement 4 MCNP inputs were used, with two tallies each at detector position for neutron and photon flux (energy-binned):
- Tally n. 4
This track length flux tally has been used to collect the energy-binned neutron fluence
- Tally n. 14
This track length flux tally has been used to collect the energy-binned photon fluence
No FM card was used as the experimental results were given per unit source neutron. During the post-processing the value in each energy bin is divided by the bin width so that to obtain the spectral fluence to be compared with experimental data from the detectors.
See also
Related papers and contributions:
M. Angelone, M. Pillon, P. Batistoni, M. Martini, M. Martone, V. Rado, “Absolute experimental and numerical calibration of the 14 MeV neutron source at the Frascati Neutron Generator”, Rev. Sci. Instr. 67(1996)2189.
H. Freiesleben, C. Negoita, K. Seidel, S. Unholzer, U. Fischer, D. Leichtle, M. Angelone, P. Batistoni, M. Pillon, “Measurement and analysis of neutron and gamma-ray flux spectra in Tungsten”, Report TUD-IKTP/01-03, Dresden, EFFDOC-857 (2003)
U. Fischer et al., Monte Carlo Transport and Sensitivity Analyses for the TUD Neutron Transport Benchmark Experiment on Tungsten, EFFDOC-860 (2002)
A. Milocco, The Quality Assessment of the FNG/TUD Benchmark Experiments, IJS-DP-10216, April 2009
ASPIS Iron-88 benchmark#
The ASPIS experiment was designed for providing information of benchmark quality for testing of data and calculation methods for deep-penetration profile by natural iron shielding material.
The ASPIS shielding facility is installed on the NESTOR reactor at Winfrith. NESTOR is a light water cooled, graphite and light water moderated reactor which operates at powers of up to 30 kW and is used as a source of neutrons for a wide range of applications. The core of the reactor, is contained within an annulus formed by two concentric aluminium vessels through which water circulates. The inner vessel is filled with graphite to form an inner reflector. The outer tank is surrounded by an external graphite reflector in the form of a block having dimensions 182 cm x 182 cm x 122 cm which contains the control plate slots adjacent to the vessel wall. Leading off each of the four faces of the external reflector is an experiment cave which can be isolated from the reactor by shutters composed of boral or combinations of neutron/gamma-ray shield materials.
ASPIS is located in the NESTOR cave C. Shield components, which are in the main slabs or tanks, are mounted vertically in a mobile tank which has an internal cross-sectional area of 1.8 m x 1.9 m and a length of 3.7 m. A fission plate is located within the experimental shield array. The loaded tank is moved into the cave where thermal neutrons leaking from the outer graphite reflector of NESTOR are used to drive the fission plate to provide a well defined neutron source for penetration measurements.
The neutron flux levels within an ASPIS shield contain contributions from sources in the fission plate and from the NESTOR core and it is essential that the NESTOR contribution is subtracted from all measured responses to arrive at the response resulting from the fission plate sources.
Experimental results derived from ASPIS-Fe88 experiment are publicly accessible at the CoNDERC database.
Geometry and run parameters#
The Iron 88 Benchmark experimental array irradiated in the ASPIS shielding facility is shown schematically in side elevation in the figure below.
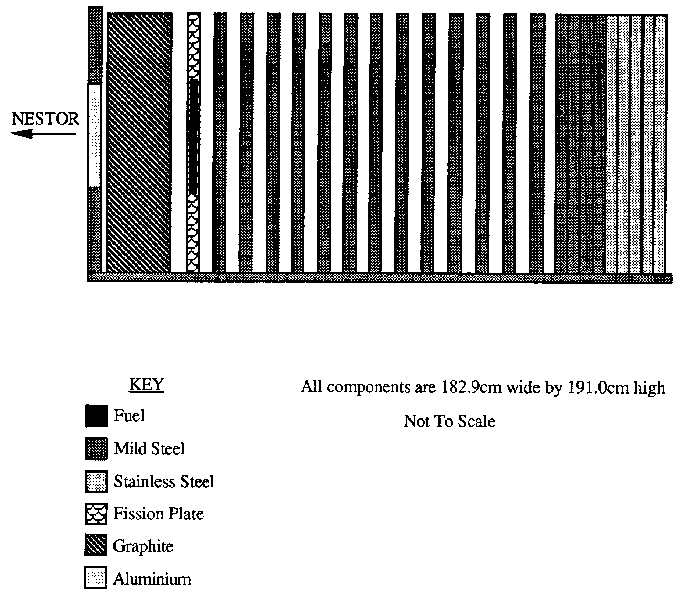
Schematic side elevation of the shield in the iron 88 single material benchmark experiment#
The array comprises three regions: the source region containing moderator and the fission plate, the shield made from 13 mild steel plates, each of approximately 5.1 cm thickness, and a deep backing shield manufactured from mild and stainless steel. To allow detector access within the shield 6 mm spacers are placed between each slab component. In practice the depth of the air gaps varies owing to positional uncertainties of the plates and their flatness. The 6 mm gap is therefore nominal and an average gap of 7.4 mm was measured for the experiment.
The outer boundaries of the experimental region are formed by the walls and floor of the ASPIS trolley and by the roof of the ASPIS cave. The floor and walls of the trolley are manufactured from 1.91 cm thick mild steel plate. The trolley base has a 25 cm high steel chassis in-filled with concrete. The structure of NESTOR surrounding the trolley comprises concrete bulk shielding blocks except on the NESTOR core side of the trolley front face where it is graphite. This graphite extends away from the trolley to the external graphite reflector of the reactor.
A schematic diagram of the fission plate is shown in the figure below.
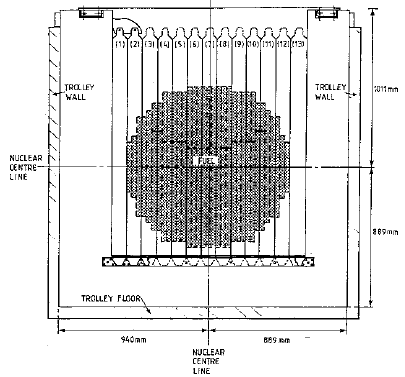
Schematic diagram of fission plate#
It comprises an aluminium frame which fills the height and width of the ASPIS trolley. Located within the frame there are 13 separate fuel elements. Each element has two 12 mm thick aluminium cover plates which attach on either side of the top and bottom locating end pieces leaving a 5 mm separation in which U/Al alloy fuel strips are located. The fuel strips are 80% by weight aluminium and 20% by weight of uranium enriched to 93% having a density of 3.256 g/cm3. Each strip is nominally 30.5 mm wide and 1 mm thick and is fixed to the rear cover plate by M5 screws.
Three columns of fuel strips laid side by side fill the width of the element. There is depth for 4 fuel strips within each element leaving a 1 mm clearance gap next to the front cover plate. In the current configuration only the central two strips in each column contain U/Al alloy, the outer two are both blanks manufactured from aluminium.
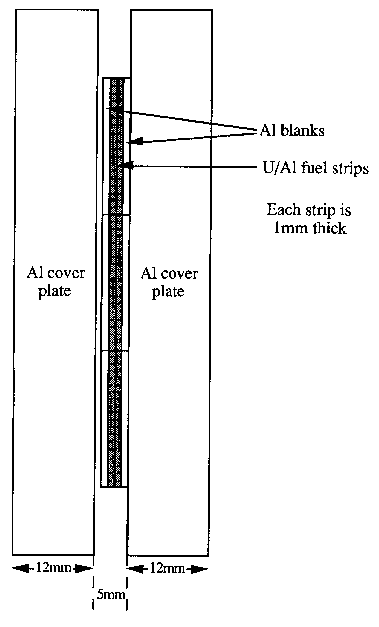
Schematic diagram of fuel element#
The centre of the fuel is at a height of 889 mm from the floor of the trolley and at 889 mm from the right hand wall of the trolley when looking towards the NESTOR core. The measurements were made on this axis.
The absolute power in the fission plate, expressed as plate Watts per NESTOR Watt, has been determined by combining measurements of the absolute fission-rate at spot values, gained by fission product decay line counting, with the fission-rate profile data. The analysis is rather involved and the result was an absolute plate power of 5.68E-4 Watts per NESTOR Watt.
The detectors used for the measurements were:
Detector |
Diameter (mm) |
Thickness (mm) |
Typical Mass (g) |
Cadmium Cover (in) |
Counting system |
System absolute calibration (uncertainty) |
|---|---|---|---|---|---|---|
Au-197(n,g) |
12.7 |
0.05 |
0.12-0.13 |
50/1000 |
NaI |
0.9% |
Rh-103(n,n’) |
12.7 |
0.015 |
0.2 |
NaI |
3.0% |
|
In-115(n,n’) |
38 |
1.63 |
12.79 |
GeLi detector |
1.9% |
|
S-32(n,p) Pressed pellet |
38.1 |
2.41 |
5 |
Plastic scintillator |
5.0% |
|
S-32(n,p) Cast pellet |
51 |
5.6 |
22 |
Plastic scintillator |
5.0% |
|
Al-27(n,alpha) |
50 |
3.1 |
16.72 |
Ge detector |
2.2% |
Detector activation measurements were carried out along the fission plate axis at the following shield thicknesses: 0, 5.1, 10.22, 15.34, 20.44, 25.64, 30.79, 35.99, 41.19, 46.44, 51.62, 56.69, 61.81, 66.99 cm. Al-27 reaction rates were measured only up to 25.64 cm.
The results were corrected for the background responses due to the NESTOR core. Using the hydrogen filled proportional counters the correction was found to be around 2% throughout the shield for the four threshold detectors. For gold measurements the measurement was repeated with the fissile content of the fission plate removed in order to determine the background correction.
MCNP modelling#
5 MCNP inputs, corresponding to the experimental setup with the 5 different foils were used. A F4 reaction rate tally is defined for each input:
- Tally n. 4
A track length flux tally has been used to collect results in the cells corresponding to the activation foils in MCNP geometry. The tally has been multiplied in each input (with FM card) by the appropriate microscopic reaction cross section, to obtain results in terms of number of reactions per unit neutron from the source. No energy bins were used. Nuclear data for tally collection was taken from IRDFF dosimetry libraries. In the following, a list of the reactions considered for each activation foil material is reported:
Rh-103(n,n’)Rh-103
Al-27(n,a)Na-24
In-115(n,n’)In-115m
S-32(n,p)P-32
Au-197(n,g)Au-198
A FM multiplier card with the normalization factor has been used to obtain the results in units of reactions per second per atom at 30 kW NESTOR power.
See also
Related papers and contributions:
G.A. Wright, M. J. Grimstone, Benchmark Testing of JEF-2.2 Data for Shielding Applications: Analysis of the Winfrith Iron 88 Benchmark Experiment, Report No. AEA-RS-1231, EFF-Doc-229 and JEF-Doc-421 (1993).
I. J. Curl, CRISP - A Computer Code to Define Fission Plate Source Profiles, RPD/IJC/934.
M. J. Armishaw, J. Butler, M. D. Carter, I. J. Curl, A. K. McCracken, A Transportable Neutron Spectrometer (TNS) for Radiological Applications, AEEW-M2365 (1986).
G. A. Wright, A. Avery, M. J. Grimstone, H. F. Locke, S. Newbon, Benchmarking of the JEFF2.2 Data Library for Shielding Applications, Proceedings, 8th International Conference on Radiation Shielding, April 24-28, 1994, Arlington, Texas, U.S.A., vol.2, p.816.
M. PESCARINI and R. ORSI, Validation of the BUGJEFF311.BOLIB, BUGENDF70.BOLIB, BUGLE-B7 and BUGLE-96 Cross Section Libraries on the Iron-88 Neutron Shielding Benchmark Experiment, ADPFISS-LP1-106, ENEA-Bologna Technical Report (2018).
A. Milocco, Quality Assessment of SINBAD Evaluated Experiments ASPIS Iron (NEA-1517/34), ASPIS Iron-88 (NEA-1517/35), ASPIS Graphite (NEA-1517/36), ASPIS Water (NEA-1517/37), ASPIS N/G Water/Steel (NEA-1517/49), ASPIS PCA Replica (NEA-1517/75), Dec. 2015.
A. Milocco, B. Zefran, I. Kodeli. Validation of nuclear data based on the ASPIS experimeents from the SINBAD database. V: Proc. RPSD-2018, 20th Topical meeting of the radiation protection and shielding division, 26-31 August 2018, Santa Fe., American Nuclear Society. 2018.
I. Kodeli, Transport and S/U analysis of the ASPIS-IRON88 Benchmark using recent and older iron cross-section evaluations. Proc. PHYSOR 2018, Reactor physics paving the way towards more efficient systems, 22 - 26 April 2018, Cancun. ANS. 2018.
Winfrith Water/Iron Benchmark Experiment (ASPIS-PCA-Replica)#
The experiment was designed to replicate the Oak Ridge Pool Critical Assembly (PCA) experiment with a highly enriched fission plate in place of the core source. Neutron spectra and reaction rate measurements were recorded through a water/iron shield as a model of the ex-core region of a pressurised water reactor (PWR). The experiment was performed in the early 1980’s.
Geometry#
ASPIS occupies one of the four experimental caves on the NESTOR reactor as seen in the figure below with the iron/water assembly immersed in water within the shielding trolley. Further description of ASPIS and NESTOR is given ASPIS Iron-88 benchmark.
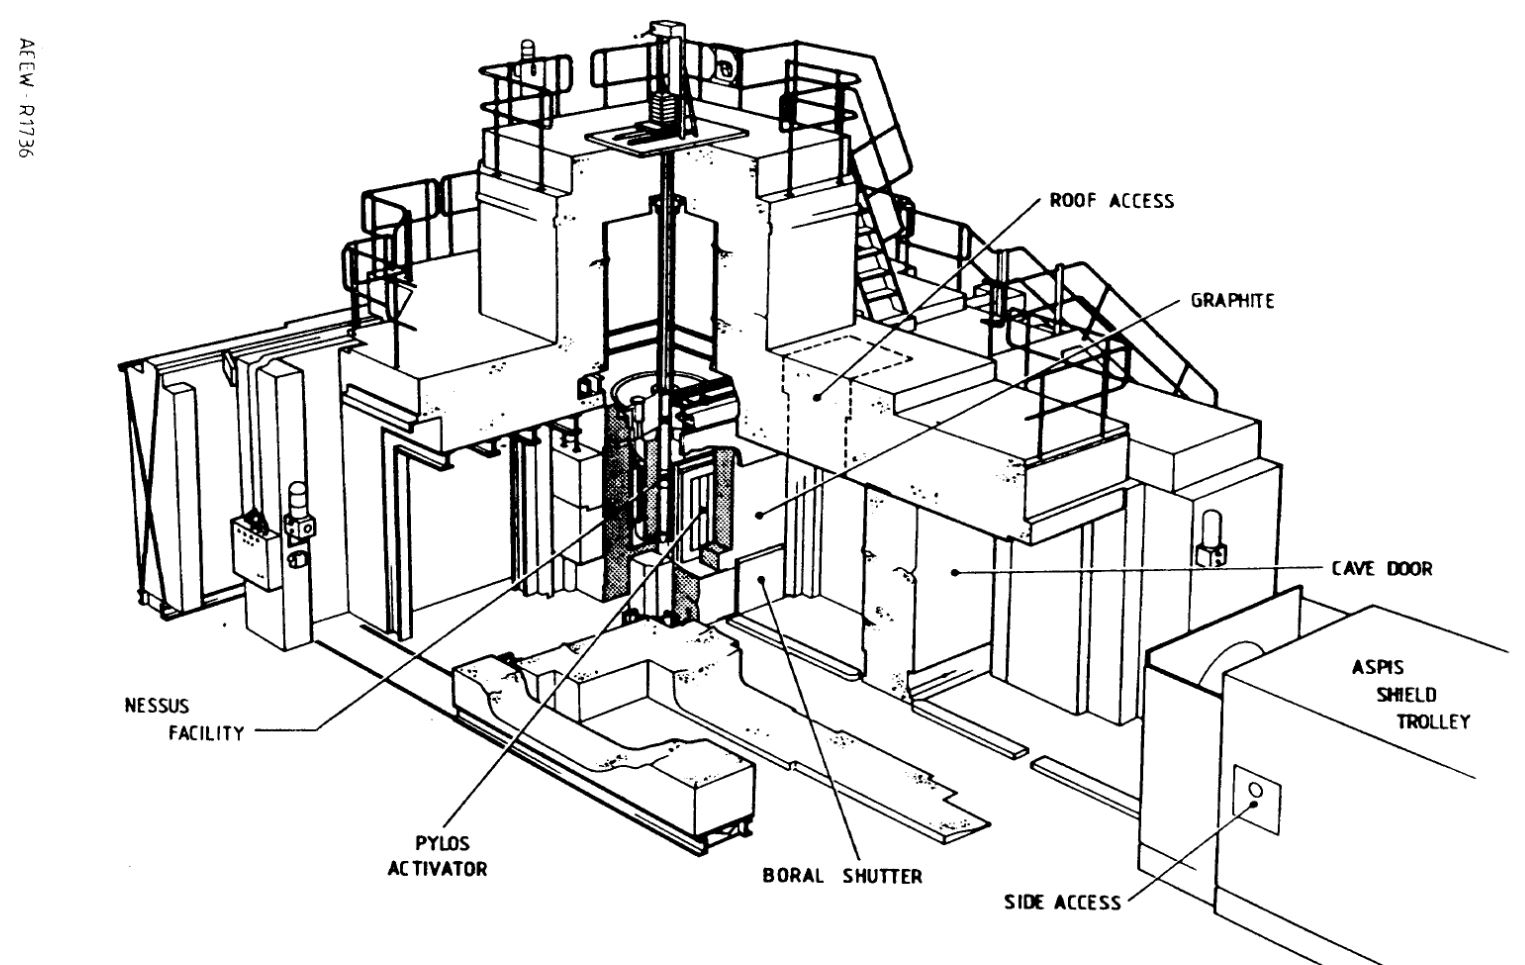
View of the NESTOR reactor and ASPIS shield trolley in one of the four experimental caves. [Reference 1]#
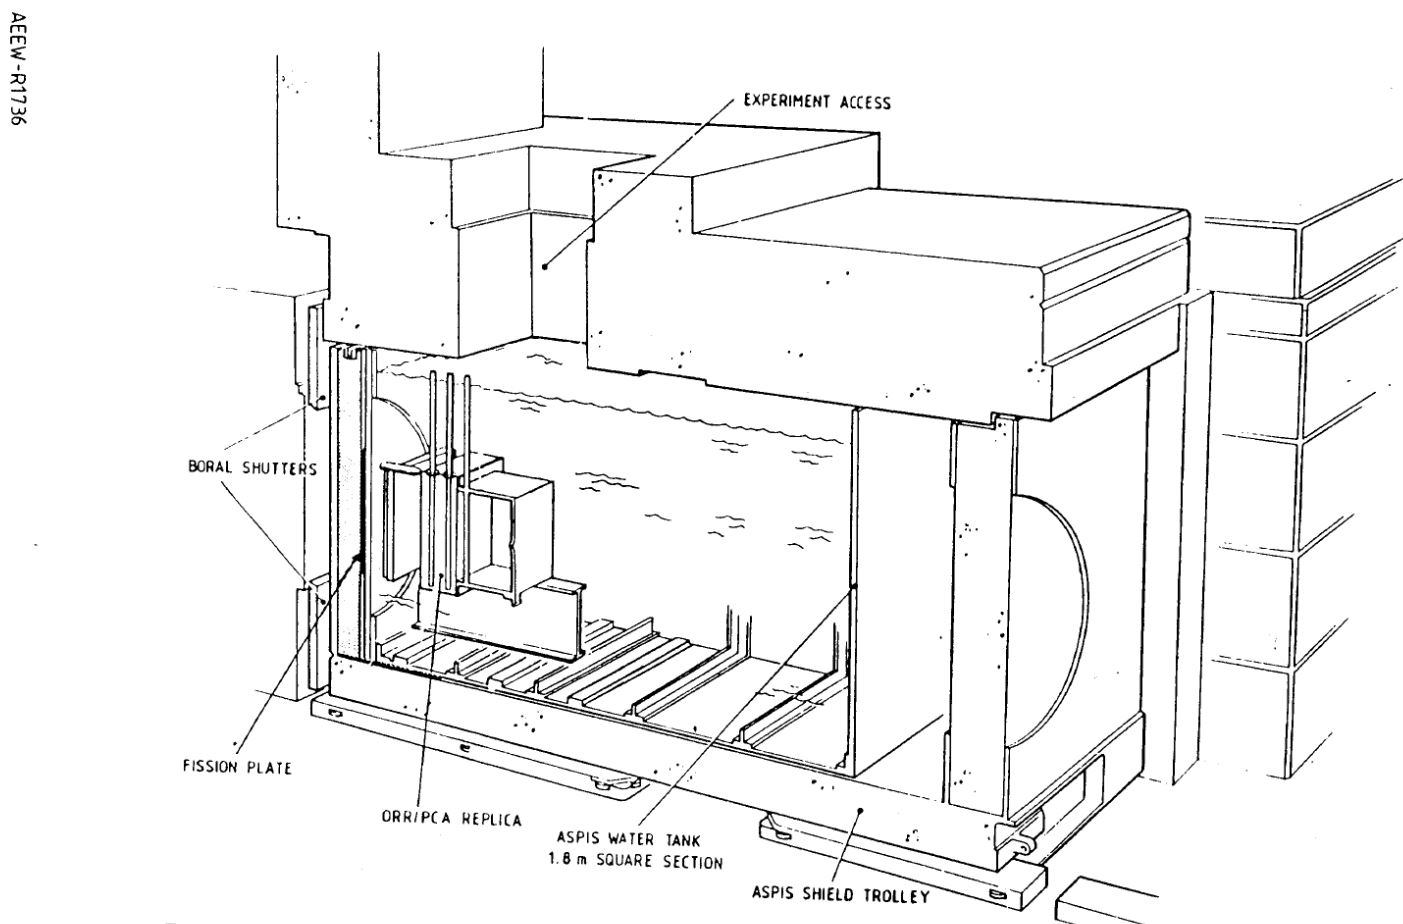
The ASPIS shield trolley containing the PCA replica experiment. [Reference 1]#
The shield assembly consists of layers of mild steel representing a PWR thermal shield and pressure vessel. Different zones are defined through the different layers as reference for different material and detector locations as seen below.
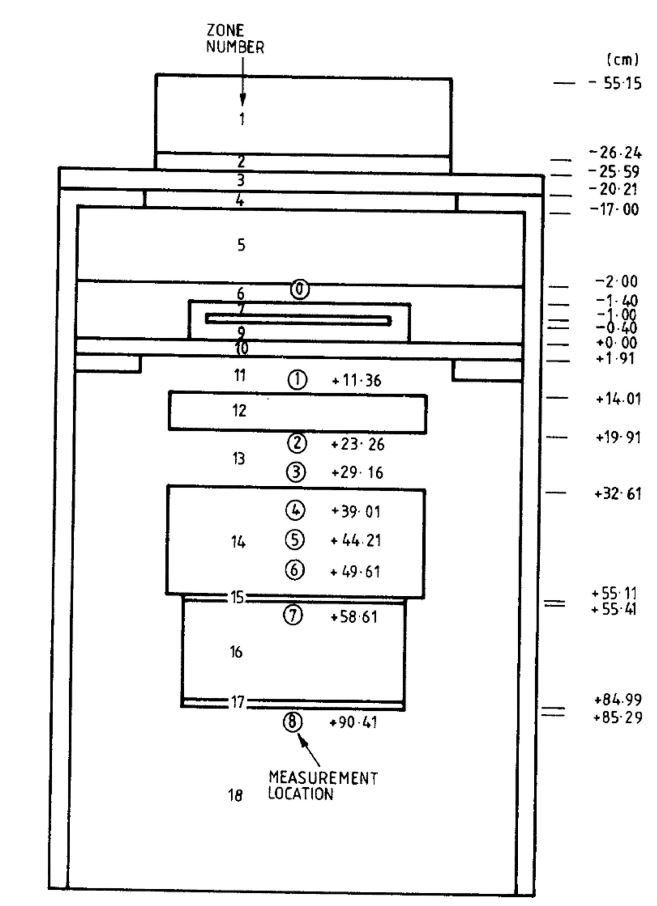
Shielding assembly in ASPIS PCA replica. [Reference 2]#
The layers are comprised of the following:
Planar neutron source (fission plate)
Water gap (12 cm)
Thermal shield sample (6 cm)
Water gap (12 cm)
Pressure vessel sample (22 cm)
Void box
Water pool
Measured data#
Through the shield assembly illustrated above, activation foils were position at 10 different positions. The neutron flux was measured in the energy range 1 to 10 MeV using NE213 organic scintillators and at lower energy with hydrogen filled proportional counters. T/4 and 3T/4 refer to different thicknesses of the pressure vessel, T.
Reaction rates: 103Rh(n,n’) at 1.91, 7.41, 12.41, 14.01, 19.91, 25.41, 30.41, 39.01 (T/4), 49.61 (3T/4) and 58.61 cm (rear void box). 115In(n,n’) and 32S(n,p) reaction rates were also measured at T/4, 3T/4 and in the void box.
Neutron Spectra: Spectral measurements were made at two locations, T/4 (position 8) and in the rear void box (position 10). The spectra have been unfolded using the RADAK code for comparison to simulation.
MCNP model#
The source term is included as an SDEF. A weight window produced using the DSA Technique is also included in the input file.
All modifications necessary to the distributed input file are captured in a patch file.
S(\({\alpha}\), \({\beta}\)) thermal treatment for graphite and water is required. The user should make sure these cross sections are available and if required update the identifier on the MTm cards in the input file.
MCNP tallies#
The reaction rates are calculated using the F4 tally in MCNP (Tally n.4). A tally multiplier has been applied to give results directly comparable to the experimental data.
The reaction MT numbers are by default assigned using the convention for IRDFF-II.
The spectra have been calculated with an F4 tally with energy binning for comparison to the measured data. A multiplier is included using the FM card (n/sec/NESTOR Watt) which following post processing performed by JADE to bin per unit lethargy, can be directly compared to the measured data.
Patch file#
Coming soon…
See also
Related papers and contributions:
Butler, J., Carter, M.D., Curl, I.J., March, M.R., McCracken, A.K., Murphy, M.F., Packwood, A., The PCA Replica Experiment PART I, Winfrith Measurements and Calculations, AEEW-R 1736, 1984
Kodeli, I., van der Marck, S., Consistency Among the Results of the ASPIS Iron88, PCA Replica, and PCA ORNL Benchmark Experiments, Nuclear Science and Engineering, https://doi.org/10.1080/00295639.2023.2199673, 2023.
Burn, K.W., Consul Camprini, P., Calculation of the NEA-SINBAD Experimental Benchmark: PCA-Replica, https://hdl.handle.net/20.500.12079/7957, 2017.
Oktavian#
Experimental results derived from Oktavian experiments are publicly accessible at the CoNDERC database which is mantained by the IAEA Nuclear Data Section and built upon the database of shielding experiments (SINBAD), hosted by the RSICC and jointly mantained with the NEA data bank.
OKTAVIAN is an experimental facility located at the Osaka University which has been operative since 1981. It consists of an intense deuterium-tritium (D-T) fusion neutron source (up to 3E+12 n/s) that has been used during the years for many experiments on high energy neutrons transport. Among them, many Time Of Flight (TOF) experiments were conducted and their results have been introduced in SINBAD. These experiments consists in placing the neutron source inside a sphere composed only by a specific material of interest and measuring the leakage photon spectra exiting from such sphere with the use of detectors. The photon energy measure is performed indirectly measuring the time of flight, which is then converted into a velocity.
Geometry and run parameters#
Simplified layout of the OKTAVIAN Fe experimental setup (not in scale).#
An accelerated deuteron beam is led through a narrow tube to the centre of a sphere (every time composed by a different material) where pulsed 14.1 MeV monochromatic neutrons were produced by the d-t fusion reaction. The source is regarded to be 14 MeV monochromatic. Neutron leakage current spectrum of neutrons was measured in “absolute values” by the time-of-flight technique between 10 keV and 14 MeV, about 9.5 m from the sphere centre. Because of the presence of the collimators the detectors could not see the entire surface of the sphere, but only the solid angle of 17.28° from the sphere centre.
Tallies#
Only two tallies are defined for each input:
- Tally n. 21
Neutron leakage current $[#/cm^2]$ per source particle. 134 energy bins were defined spanning from 0.1 MeV to 20.6 MeV.
- Tally n. 41
Photon leakage current $[#/cm^2]$ per source particle. 57 energy bins were defined spanning from 0.5 MeV to 10.5 MeV.
Since experimental results are provided as flux per unit lethargy, the tally results are manipulated as follows:
See also
Related papers and contributions:
A. Milocco, A. Trkov and I. A. Kodeli, 2010, “The OKTAVIAN TOF experiments in SINBAD: Evaluation of the experimental uncertainties”, Annals of Nuclear Energy, 37 443-449
I.Kodeli, E. Sartori and B. Kirk, “SINBAD - Shielding Benchmark Experiments - Status and Planned Activities”, Proceedings of the ANS 14th Biennial Topical Meeting of Radiation Protection and Shielding Division, Carlsbad, New Mexico (April 3-6, 2006)
Tiara#
The TIARA (Takasaki Ion Accelerator for Advanced Radiation Application) shielding experiment is one among the several high quality experiments included in the SINBAD database. Like Oktavian benchmark, experimental results derived from Tiara experiments are publicly accessible at the CoNDERC database.
The shielding experiment was performed at JAERI (Japan Atomic Energy Research Institute). The neutron source was produced by bombarding a 99.9% Li-7 target with a high energy proton beam from a cyclotron. Two quasi-monoenergetic neutron sources resulted from the bombardment, with peak energies at 43 MeV and 68 MeV. Three different detectors were used to collect data: the BC 501A liquid scintillation detector, a series of Bonner sphere detectors and finally U-238 and Th-232 fission cells to measure the reaction rates.
Geometry and run parameters#
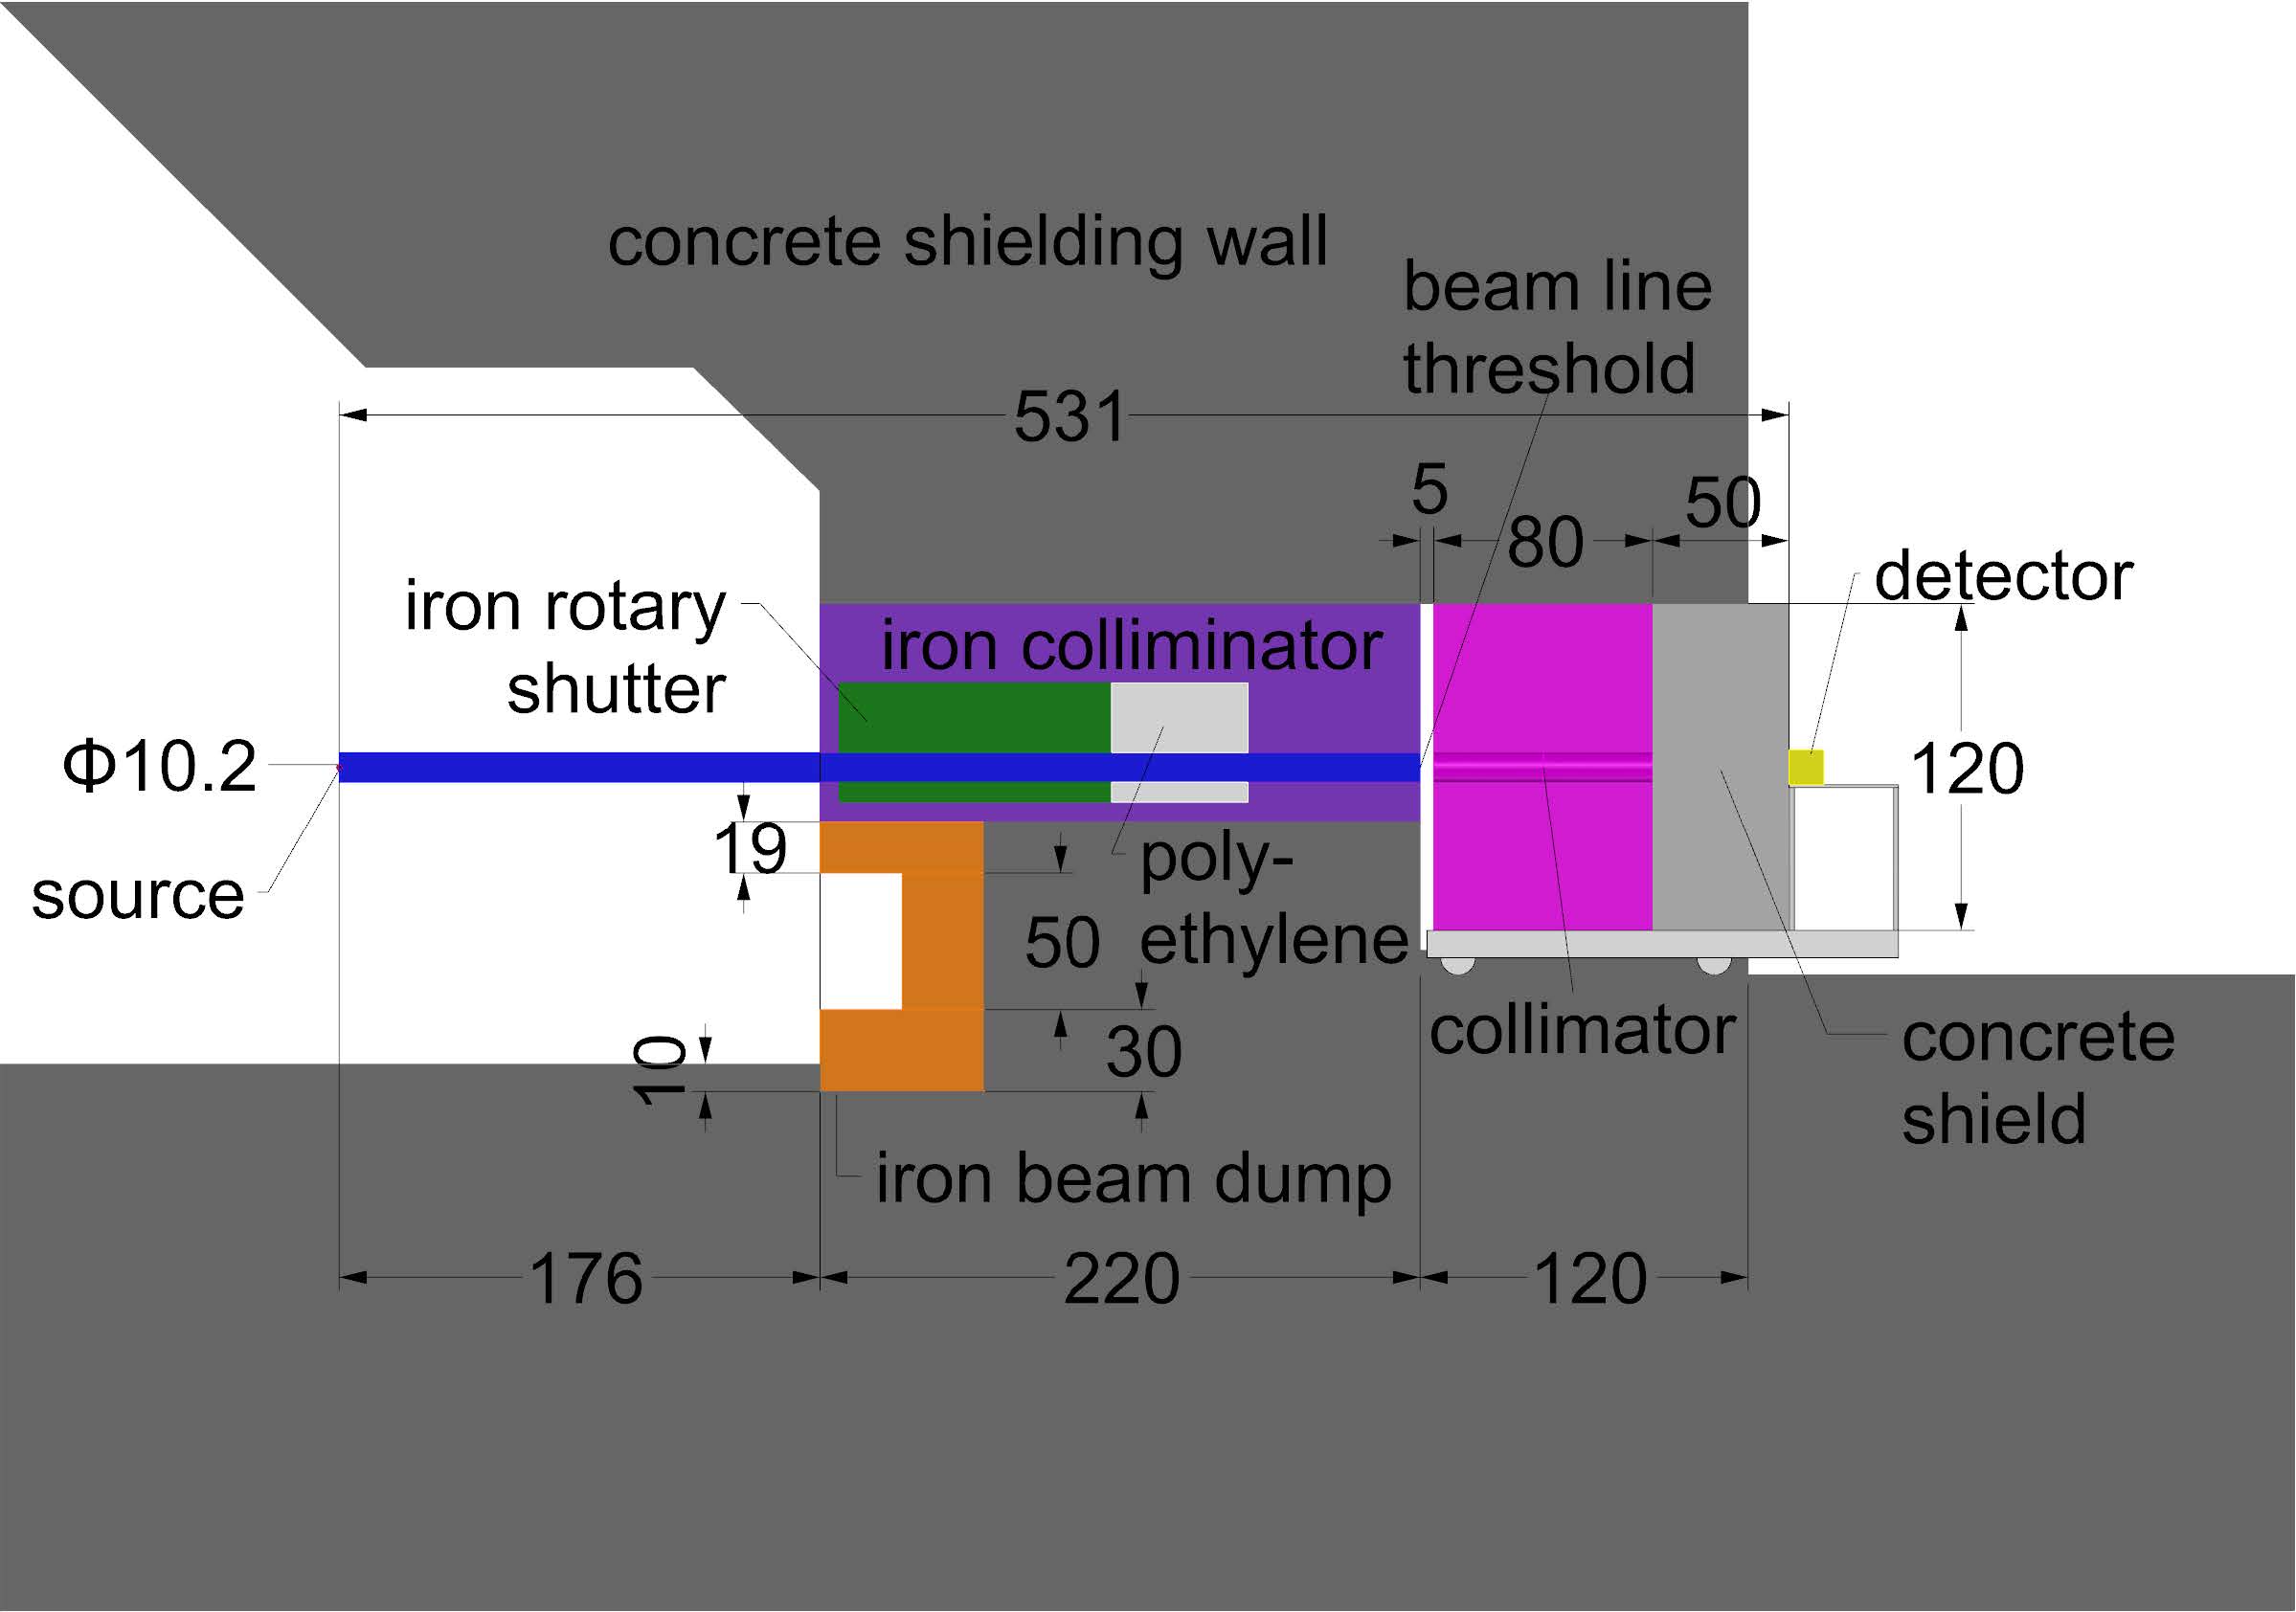
CAD model of Tiara Experiment. Dimensions in cm.#
The neutron source for the benchmark experiment is produced by 43 MeV and 68 MeV protons incident on a 99.9 % enriched Li-7 target. The neutrons generated in the target pass through a 225 cm long iron collimator, placed in a thick concrete wall which surrounds the accelerator. The neutron source spectra are measured 14 m from the target with an organic scintillator by the time-of-flight measurement technique and is normalized per 1 microC of source proton charge. After the collimator, different shieldings of two different materials - iron and concrete - are placed. Iron shielding thickness ranges from 0 cm to 130 cm, while concrete shielding thickness ranged from 0 cm to 200 cm. Additional collimators of different thicknesses can be placed before the shielding. Energy spectra are obtained by unfolding the resulting recoil spectra produced in a 12.7 cm by 12.7 cm BC 501A scintillator. Additionally to spectra measurements with the BC 501A scintillator, measurements with a series of Bonner sphere counters are performed. On and off axis measurements of reaction rates are also performed with U-238 fission cell and Th-232 fission cell.
MCNP modelling#
Because three different types of detectors are used, with different type of output data, TIARA benchmark is divided into three separated benchmarks. For each detector benchmark, measurements with different neutron source energies, shielding material, shield thickness and additional collimator thickness are made. Because TIARA is a deep shielding problem, variance reduction is needed to perform effective and fast simulations. The variance reduction is performed at the source, with its geometry being limited to a conical shape, and with energy dependant weight windows determined by the ADVANTG hybrid deterministic/Monte Carlo code. The weight windows files can be provided on request. The three cases with three different detectors were modelled with 3 different tallies:
- BC 501A scintillators:
The BC 501A liquid scintillator tally is modelled as a F4 volume tally. In MCNP geometry the actual detectors are modelled as a cylinder with a height of h = 12.7 cm and a diameter of d = 12.7 cm. The cylinders are filled with a liquid scintillator material, defined in the technical documentation of the detector, and positioned on-axis and/or off-axis, tih offsets of 20 cm and 40 cm, depending on the case. The tally results are then normalized according to the SINBAD documentation, by a normalization factor calculated with the following equation:
\[\Phi_{normalized} = \Phi_{MCNP}^{F4}*PtC*PF*4\pi\]Where the factors in the equation are:
PtC = Peak to continuum normalization factor (2.17 for the 43 MeV neutron source and 2.61 for the 43 MeV neutron source).
PF = peak flux of source neutrons which differs from case to case.
solid angle factor
Finally, tallies are divided into energy bins according to experimental results, for easier comparison with the latters. Since experimental results are provided as flux per unit lethargy, tally results are manipulated as follows:
\[d\Phi_u = d\Phi/d(\log{E})\]- Bonner spheres detectors:
The Bonner sphere detectors are modelled as simple spheres with diameters which correspond to the diameters of the different polyethylene moderators (bare, 15 mm, 30 mm, 50 mm, 90 mm). The F4 tallies have volumes which correspond to the volumes of the spheres. The spheres are filled with air, but the responses are modified with linearly interpolated energy response functions. Then, the result of the tally is multiplied by the same normalization factor applied for scintillators.
- Fission cells detectors:
The fission cells are modelled as cylinders (height: h = 10.1 cm, diameter: d = 3.81 cm). The cylinders are filled with air, but the responses are modified with linearly interpolated fission cross sections. Then, the result of the tally is multiplied by the same normalization factor applied for scintillators.
See also
Related papers and contributions:
Bor Kos and I. A. Kodeli, “MCNP modelling of the TIARA SINBAD shielding benchmark”, September 2018
FNS Time-of-Flight Experiment#
Two types of integral experiments for nuclear data benchmark tests with DT neutrons have been performed for more than 30 years at JAEA/FNS for the purpose of validation of nuclear data for fusion reactors materials: an in-situ experiment and a Time-of-flight (TOF) experiment.
Deuteron beams were accelerated to 350 keV by the electrostatic accelerator of the FNS (Fusion Neutronics Source) facility at JAERI on a tritium-metal targert and 14 MeV neutrons were produced by DT fusion reaction. In the TOF experiment, an assembly was placed 200 mm from the DT neutron source and leakage angular neutron spectra from the assembly above 100 keV were measured at angles of 0, 12.2, 24.9, 41.8 and 66.8 degrees with the TOF method.
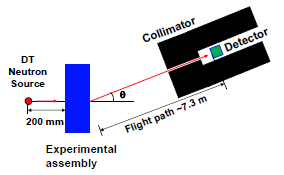
Experimental configuration of the TOF experiment#
Experimental assemblies with different size and materials were used:
Material |
Shape |
Size |
|---|---|---|
Be |
Quasi-cylinder |
630 mm in effective diameter; 51, 152 mm in thickness |
C |
Quasi-cylinder |
630 mm in effective diameter; 51, 203, 406 mm in thickness |
Liquid \(N_2\) |
Cylinder tank |
600 mm in diameter; 200 mm in thickness |
Liquid \(O_2\) |
Cylinder tank |
600 mm in diameter; 200 mm in thickness |
Fe |
Cylinder |
1000 mm in diameter; 50, 200, 400, 600 mm in thickness |
Pb |
Quasi-cylinder |
630 mm in effective diameter; 51, 203, 406 mm in thickness |
Experimental results derived from FNS TOF experiment are publicly accessible at the CoNDERC database.
Geometry and run parameters#
Deuteron beams were accelerated to 350 keV and driven towards the target. The 14 MeV DT neutrons were generated at a 3.7x \(10^2\) GBq (10 Ci) tritium-metal target. The neutron yield at the target was monitored by detecting the associated alpha-particles with a silicon surface-barrier detector (SSD) emplaced in the beam line.
The detector-collimator system determined the area on the rear surface of slab and the solid angle by which the angular neutron flux was defined. The area was designed to be about 50 mm in diameter by choosing the sizes of the detector and the collimator opening. The detector-collimator system was placed on the dual rotating deck. The system consisted of an upper and a lower deck to perform the experiments on different thick slabs with combination of their rotation. The lower deck moves centering around the target (neutron source), and then the upper deck rotates slightly relative to the lower deck to adjust the axis to the measured direction, i.e., the center of rear-face of the slab. The detector-collimator axis can be adjusted to any point around the neutron source by these two motions.
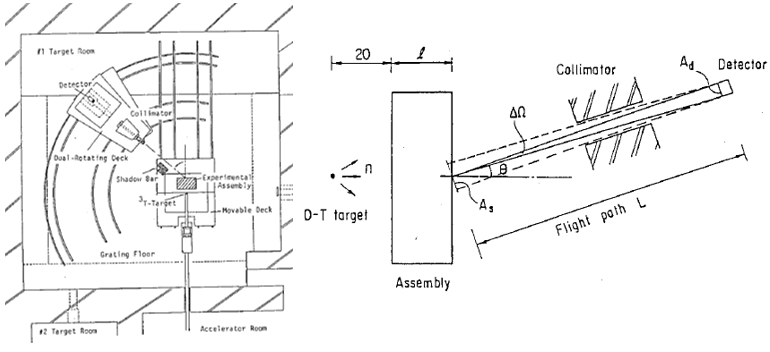
Experimental configuration of the TOF experiment and definition of useful parameters#
The angular flux measurement is performed in foreground-background mode. The background is measured by blocking the collimator hole with a plug of type 304 stainless steel of 0.6 min length and polyethylene of 0.4 min length. Background data are subtracted from the foreground data. Measured time spectra are then transformed to energy spectra.
The measured data are reduced to the angular flux by the following equation:
- where:
\(\Phi(\Omega, E_n)\): neutrons with energy \(E_n\) per unit lethargy and emitting solid angle \(\Delta\Omega\) per unit source neutron at the rear surface center of the assembly
\(C(E_n)\): counts per unit lethargy for neutrons of energy \(E_n\)
\(\epsilon(E_n)\): efficiency of neutron detector at energy \(E_n\)
\(\Delta\Omega\): solid angle subtended by the detector to the target, i.e., \(\Delta\Omega=A_d/L^2\), where: \(A_d\): counting area of the detector; L: distance from the target to the detector,
\(A_s\): effective measured area defined by the detector collimator system on the plane perpendicular to the axis at the assembly surface. It is determined from an experimental detector-collimator response function and it is given by the equation: \(A_s = 0.2304·L - 84.16\), where L is the flight path length in cm
\(S_n\) total source neutrons obtained by the associated alpha particle monitor,
\(T(E_n)\): attenuation due to air in neutron flight path: \(e^{-\Sigma_{air}(E_n)·L}\), \(\Sigma_{air}(E_n)\) : macroscopic total cross section of air.
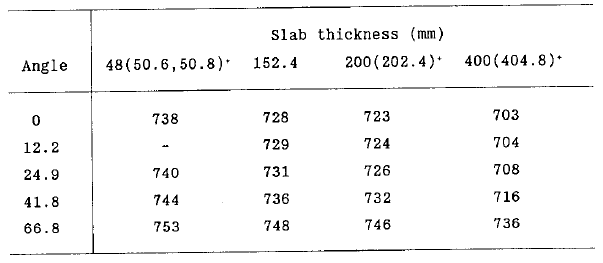
The dependence of flight path length on mesuring angle is given in the following table:
MCNP modelling#
A point Monte Carlo method is adopted for a nuclear data test, for each tested slab. The point detector estimator is used and five detector locations are taken into account corresponding to the measured angles. The example of calculational model is shown in the figure below
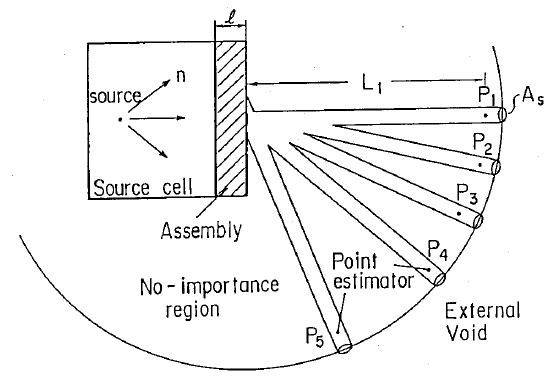
Representation of 3D model for MCNP calculations of FNS-TOF experiment#
In this model, the collimator is simulated by cylindrical hole with the radius of effective measured area \(A_s\). This cylindrical hole is surrounded by no-importance regions in which neutron histories are immediately terminated.
One point detector tally has been used for each detector position:
- Tally n. 5
This detector-flux tally has been used to collect the energy-binned neutron leakage flux at 0 degrees
- Tally n. 15
This detector-flux tally has been used to collect the energy-binned neutron leakage flux at 12.2 degrees
- Tally n. 25
This detector-flux tally has been used to collect the energy-binned neutron leakage flux at 24.9 degrees
- Tally n. 35
This detector-flux tally has been used to collect the energy-binned neutron leakage flux at 41.8 degrees
- Tally n. 45
This detector-flux tally has been used to collect the energy-binned neutron leakage flux at 66.8 degrees
No FM card was used as the experimental results were given per unit source neutron. During the post-processing the value in each energy bin is divided by the lethargy bin width. The calculated leakage lethargy flux are reduced to the measured quantity by multiplying by \(L^2/A_s\) for each detector position.
See also
Related papers and contributions:
Oyama, Y., Yamaguchi, S., Maekawa, H., Experimental results of angular neutron flux spectra leaking from slabs of fusion reactor candidate materials, I, JAERI-M 90-092, 124p. (1990).
Sub Working Group of Fusion Reactor Physics Subcommittee (Ed.), “Collection of Experimental Data for Fusion Neutronics Benchmark”, JAERI-M 94-014 (1994) 302p.
TUD Iron Slab Benchmark Experiment#
TUD Iron Slab Benchmark Experiment consists in the determination of spectral neutron flux, spectral photon flux and neutron time-of-arrival (TOA) flux penetrating and leaking iron slab assemblies (thickness: 30 cm; solid and with gap) irradiated with 14 MeV neutrons
Experimental results derived from TUD Iron Slab Benchmark Experiment are available in SINBAD database.
Geometry and run parameters#
The neutron source was a 14 MeV d-T neutron generator operated in pulsed mode. The time distribution of the source neutrons was proportional to \(exp[-(t/1.4 ns)^2]\). The Fe slabs had a front area of 100 cm x 100 cm and a thickness of 30 cm and were built up by bricks with dimensions of 20 cm x 10 cm x 5 cm. Three assemblies were built up: A0 - no gap, A1 - vertical gap, distance: 10 cm from the centre, gap width: 5 cm, and A2 - vertical gap, distance: 20 cm from the centre, gap width: 5 cm. The three configurations are shown in the figure below:
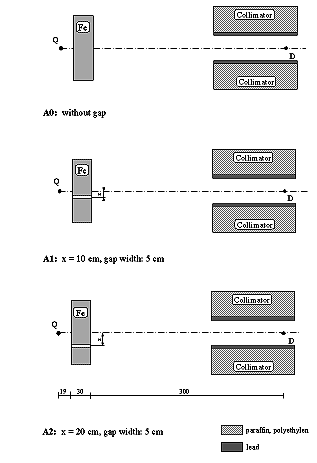
Geometries A0, A1, A2#
The distance between neutron source and Fe slab was 19 cm. The distance between Fe slab and detector was 300 cm. The distance between neutron source and detector was 349 cm. The angle between the d-beam of the neutron generator and an axis crossing neutron source and centre of the slab was 74 degrees. The detectors were positioned in a collimator shaped in such a way that all neutrons and photons leaking from the slab in direction of the detector could be observed.
A NE213 scintillator was employed for simultaneously measuring the spectral neutron flux, the spectral photon flux, and the neutron time- of-arrival spectrum for neutron energies of E>1 MeV and photon energies of E>0.2 MeV. For each registered event the pulse-height, the time-of-arrival, and a pulse-shape parameter were recorded to distinguish between neutrons and photons. Pulse-height distributions from three different hydrogen-filled proportional detectors and a stilbene scintillator were used for determining the neutron flux spectra for energies ranging from 30 keV up to about 2.3 MeV, overlapping with the NE213 spectra.
MCNP modelling#
3 MCNP models corresponding to A0, A1 and A2 geometries were employed. Point-flux-detectors for neutrons and photons were used as detector tallies in the locations corresponding to the detectors in the experiment:
- Tally n. 5
Neutron fluence (binned in energy groups)
- Tally n. 15
Neutron fluence (binned in time groups) For comparison with the experimental time-of-arrival spectrum, the calculated neutron fluence PHI(t,E) was folded with the neutron detection efficiency EPS(E) (DE/DF MCNP cards) of the NE213 detector in accordance with the measurement.
No FM card was used as the experimental results were given per unit source neutron. During the post-processing the value of the fluence in each energy bin is divided by the bin width so that to obtain the spectral fluence [#/cm^2/MeV/n] and spectral time-of-arrival fluence [#/cm^2/shakes/n] to be compared with experimental data from the detectors.
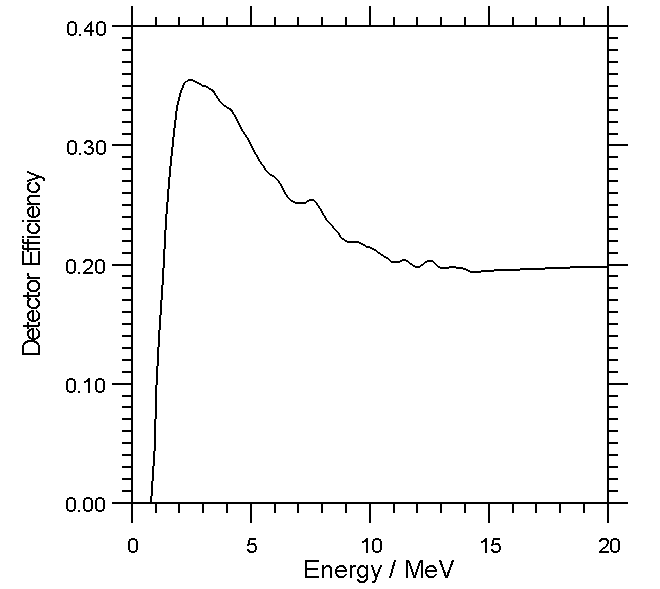
Neutron detection efficiency of NE213 detector#
- Tally n. 25
Photon spectral fluence [#/cm^2/MeV/n] (binned in energy groups)
See also
Related papers and contributions:
Freiesleben, W. Hansen, H. Klein, T. Novotny, D. Richter, R. Schwierz, K. Seidel, M. Tichy, S. Unholzer, Experimental results of an iron slab benchmark, Report Technische Universitaet Dresden, TUD-PHY-94/2, February 1995
Freiesleben, W. Hansen, D. Richter, K. Seidel, S. Unholzer, Experimental investigation of neutron and photon penetration and streaming through iron assemblies, Fusion Engineering and Design 28 (1995) 545-550
Freiesleben, W. Hansen, D. Richter, K. Seidel, S. Unholzer, Shield Penetration Experiments, Report Technische Universitaet Dresden, Institut fuer Kern- und Teilchenphysik, TUD-IKTP-95/01, January 1995
Freiesleben, W. Hansen, D. Richter, K. Seidel, S. Unholzer, TUD experimental benchmarks of Fe nuclear data, Fusion Engineering and Design 37 (1997) 31-37
Fischer, H. Freiesleben, H. Klein, W. Mannhardt, D. Richter, D. Schmidt, K. Seidel, S. Tagesen, H. Tsige-Tamirat, S. Unholzer, H. Vonach, Y. Wu, Application of improved neutron cross-section data for Fe-56 to an integral fusion neutronics experiment, Int. Conf. on Nuclear Data for Science and Technology, Trieste (Italy), May 19-24, 1997
Tichy, The DIFBAS Program - Description and User’s Guide, Report PTB-7.2- 193-1, Braunschweig 1993
Guldbakke, H. Klein, A. Meister, J. Pulpan, U. Scheler, M. Tichy, S. Unholzer, Response Matrices of NE213 Scintillation Detectors for Neutrons, Reactor Dosimetry ASTM STP 1228, Ed. H. Farrar et al., American Society for Testing Materials, Philadelphia, 1995, p. 310-322
Buermann, S. Ding, S. Guldbakke, S. Klein, H. Novotny, M. Tichy, Response of NE213 Liquid Scintillation Detectors to High-Energy Photons, Nucl. Instr. Methods A 332(1993)483
F. Briesmeister (Ed.), MCNP - A general Monte Carlo n-particle transport code, version 4A, Report, Los Alamos National Laboratory, LA-12625-M, November 1993
Ganesan and P. K. McLaughlin, FENDL/E - evaluated nuclear data library of neutron interaction cross-sections and photon production cross-sections and photon-atom interaction cross-sections for fusion applications, version 1.0, Report IAEA-NDS-128, Vienna, May 1994
Kopecky, H. Gruppelaar, H.A.J. Vanderkamp and D. Nierop, European Fusion File, Version-2, EFF-2, Final report on basic data files, Report, ECN-C-92-036, Petten, June 1992.
Wu, Report FZKA-5953, Karlsruhe, 1997
Milocco, The Quality Assessment of the FNG/TUD Benchmark Experiments, IJS-DP-10216, April 2009
(IPPE-DT) Institute of Physics and Power Engineering DT Iron Sphere Experiment#
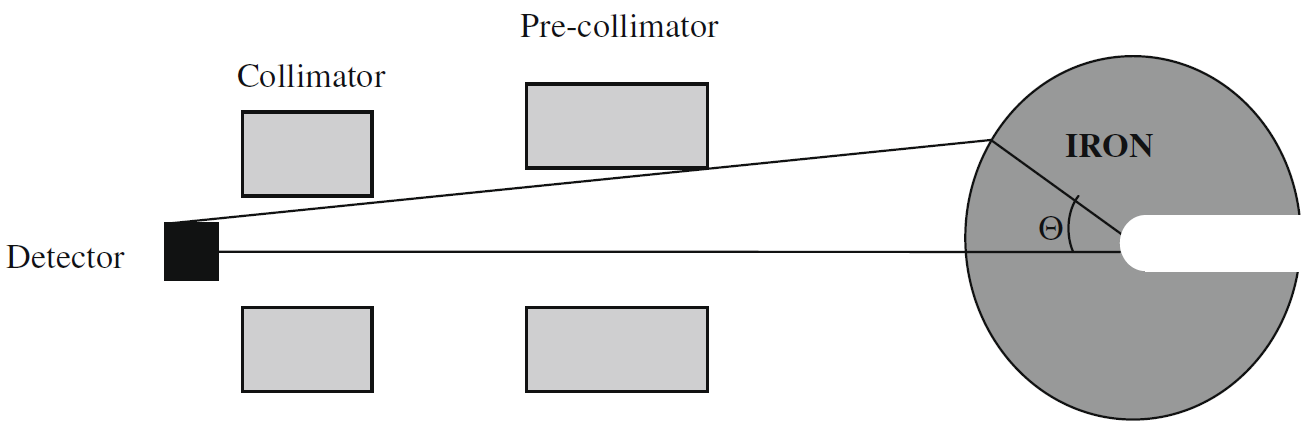
The IPPE DT Iron Sphere Experiment was carried out at the Institute of Physics and Power Engineering (IPPE) in Obninsk, Russia, to provide benchmark data for validating neutron transport codes and nuclear data libraries. The experiment focused on measuring neutron leakage spectra from iron spheres irradiated by 14 MeV neutrons produced at their center by a deuterium-tritium (DT) neutron generator. It is part of the SINBAD database, which provides compilations of shielding and dosimetry benchmark experiments. The IPPE iron experiments with the DT source were established as a benchmark problem within the EU CONRAD project in year 2007. In such instance, attention was drawn on the simulation of the neutron spectra in time domain, then converting those into the energy domain consistently with experimental method, since a direct analysis in the energy domain would shift and jag multiple scattering effects, which is evident in the resonance region of the leakage spectra from thick shells.
Geometry and run parameters#
The experiment used a Cockcroft-Walton accelerator to produce 280 keV deuterons, which bombarded a solid titanium-tritium target to generate 14 MeV neutrons. The neutron source was placed at the center of a spherical iron assembly. The total iron thickness varied from 2.5 cm to 28.0 cm across different configurations. A fast scintillation detector was positioned 6.8 meters from the source at 8-degree angle to measure neutron leakage using the time-of-flight technique. The setup included lead shielding and collimation, and alpha particle detection was used to monitor neutron yield. Room return was subtracted after performing a measurement with a shadow bar.
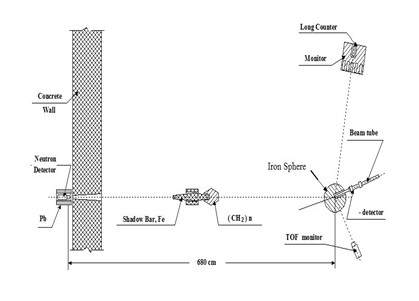
Experimental setup#
MCNP modelling#
Two tallies are employed to compute the neutron leakage spectrum both in the energy (Tally 5) and time domain (Tally 15) by means of a MCNP F5 point detector.
See also
Related papers and contributions:
S. Simakov, B.V. Devkin, M.G. Kobozev, V.A. Talalaev, U. Fischer, U. von Möllendorff, “Validation of evaluated data libraries against an iron shell transmission experiment and against the Fe(n,xn) reaction cross section with 14 MeV neutron source”, Report EFF-DOC-747, NEA Data Bank, Dec. 2000, Paris
I. Kodeli, A. Milocco and A. Trkov, “Lessons learned from the TOF-benchmark intercomparison exercise within EU CONRAD project (how not to misinterpret a TOF-benchmark)”, Nucl Technol 168 3 (2009) 965-969
I. Kodeli and E. Sartori, “SINBAD - Radiational shieding benchmark Experiments”, Annals of Nuclear Energy, 159 (2021) 108254
(IPPE-CF) Institute of Physics and Power Engineering 252Cf#
In the 1980’s at the Institute of Physics and Power Engineering (IPPE) in Obninsk, Russia, several experiments were executed to study the spectra of neutrons and gamma-ray photons flowing away from iron spheres of different diameters with a 252Cf radionuclide source placed at the center of these spheres. Measurements of the spectra were made outside the spheres. For the measurements of spectra, the following spectrometers were used: - scintillation spectrometer of neutrons and gamma rays with a crystal of stilbene; - spectrometer of neutrons based on the hydrogen-recoil proportional counter; - multisphere spectrometer of neutrons, as a set of polyethylene spheres (so called Bonner spheres) with a semi-conductor detector of thermal neutrons at the center of these spheres. The purpose of the experiments, which is taken from ICSBEP and identified as ALARM-CF-FE-SHIELD-001, was the research of neutron-physics characteristics of iron, which is the basis of the majority of construction materials and shielding of nuclear reactors. Besides this, the obtained experimental information could possibly be used to update and increase the accuracy of iron nuclear cross sections.
Geometry and run parameters#
The experiment consists in measurement of the spectra of neutrons and gamma rays emitted from the surface of the iron spheres with diameters 20.0, 30.0, 40.0, 50.0, 60.0, and 70.0 cm at whose centers the 252Cf radionuclide source of neutrons has been placed. The uncertainty of the outer diameter of spheres was ± 0.1 cm. The iron spheres were set-up on an aluminium support and steel frame. The distance from the center of the spheres to the nearest wall of the experimental hall was more than 4 m.
Iron Sphere with Plug and Cavity for the Source#
For introduction of the californium source into the center of the spheres, a special radial channel 25 mm in diameter had been drilled. This channel was closed by an iron plug at the end of which was a cylindrical cavity, centered in the sphere, with depth 19 mm and 15 mm in diameter, for accommodation of the source. Detectors of neutrons and gamma-ray photons were each fastened to a tripod which allowed the detectors to be moved to different distances from the spheres.
Iron Sphere with Plug and Cavity for the Source.#
MCNP modelling#
A surface tallies is employed to compute the neutron spectra at the external surface of the Iron sphere. Tally 2 refers to the hydrogen-recoil proportional counter and Tally 12 to the stilbene scintillation spectrometer.
See also
Related papers and contributions:
ICBEP, NEA/NSC/DOC/(95)03/VIII, Volume VIII, ALARM-CF-FE-SHIELD-001, neutron and photon leakage spectra from cf-252 source at centers of six iron spheres of different diameters
(RCR-SS) RCR Stainless Steel Block Experiment with 252Cf source#
In 2021 at the Research Centre Řež (RCR, Centrum Výzkumu Řež), a series of experiments were performed to study neutron activation and fast neutron leakage spectra from a large stainless-steel block (SST 321) with a 252Cf spontaneous fission neutron source placed at its geometric center. Multiple runs with and without a shielding cone (iron and borated polyethylene) to separate direct leakage from room-scattered background.
The experiment is identified as ALARM-CF-SST-SHIELD-001 in the ICSBEP database and was adopted by the International Nuclear Data Evaluation Network (INDEN) for the validation of Fe cross section above 1.5 MeV.
Benchmark structure#
The benchmark is organized into two experimental cases, each with a distinct measurement configuration and purpose:
- Case 1: Fast Neutron Leakage and Spectrum Measurement & Surface Activation Foil Measurements
- Objective:
Measure the direct fast neutron leakage and its energy spectrum from the stainless steel block.
Measure the spatial distribution of neutron-induced reaction rates on the surface of the block.
- Method:
Proton recoil method using hydrogen proportional counters (HPD, 0.1-1.3 MeV neutrons) and a stilbene scintillation detector for 0.8-12 MeV neutrons, with digital pulse shape discrimination for neutron/gamma separation.
Activation foils (58Ni(n, p)58Co, 115In(n, n’)115m1) are placed at defined positions on the block surface and irradiated during the neutron leakage measurements.
- Details
The neutron fluence rate and spectrum are measured at a fixed distance (1 m from the block center, 74.8 cm from the surface) with and without a shielding cone to separate direct leakage from background (room return).
The reaction rates are determined by gamma spectrometry (HPGe detector) after irradiation, normalized per source neutron and per target atom.
- Case 2: Internal Activation Foil Measurements
- Objective
Measure the spatial distribution of neutron-induced reaction rates inside the block.
- Method
Activation foils (63Cu(n,g)64Cu, 197Au(n,g)198Au, 181Ta(n,g)182Ta, 93Nb(n,2n)92mNb, 58Ni(n,p)58Co, 97Au(n,2n)196Au) are placed between the plates at four depths (5.04, 10.08, 15.12, 20.16 cm from the surface) inside the block.
- Details
The block is disassembled, foils are inserted, and the block is reassembled and irradiated. Reaction rates are measured by HPGe gamma spectrometry.
Geometry and run parameters#
- Block dimensions: \(50.4\,\mathrm{cm} \times 50.2\,\mathrm{cm} \times 50.2\,\mathrm{cm}\) (increased to 50.662 cm for
some configurations with foils inside).
- Material: Stainless steel (SST 321), composition determined by XRF analysis (Fe 67.8%, Cr 19.7%, Ni 9.3%, Mn 1.8%, Mo 0.4%,
Si 0.3%, Cu 0.3%, Ti 0.3%, V 0.06%, Sn 0.01%).
Density: 7.9083 \(g/cm^3\)
Source: 252Cf oxide in a palladium matrix, encapsulated in double stainless-steel cladding.
- Source position: Geometric center of the block, placed in a 2.6 cm diameter, 28.1 cm deep hole drilled in a central
3 cm thick plate.
- Experimental hall: Room dimensions \(7.24\,\mathrm{m} \times 6.5\,\mathrm{m} \times 7.2\,\mathrm{m}\) (height),
block center 2 m above floor.
- Set-up of cases
Case-1: It contains only the activation foils on the outside the stainless steel block (on the surface) and the neutron detectors.
Case-2: It contains only the activation foils within the stainless steel block.
Case 1: Neutron spectra measurement setup with shielding cones.#
Case 2: Cross section of stainless steel block.#
MCNP modelling#
Two MCNP inputs, corresponding to the two experimental cases were used:
- For case 1
- Detector tallies, Fn5 MCNP type
Two detector-flux tallies have been used to collect the energy-binned neutron spectra at the same detector position with a course energy binning (F5) and a finer one (F15) which matches the measurement performed.
- Track length flux tallies, Fn4 MCNP type
A track length flux tally has been used to collect results in the cells corresponding to the activation foils in MCNP geometry. The tally has been multiplied in each input (with FM card) by the appropriate microscopic reaction cross section, to obtain results in terms of number of reactions per unit neutron from the source. Energy binning was applied to half of the tallies, while the other half recorded the total reaction rate in the same cells (see table below). Nuclear data for tally collection was taken from IRDFF-II dosimetry libraries. In the following, a list of the reactions considered for each activation foil material is reported:
Tally No. |
Where |
Foils Reactions |
Energy binning |
|---|---|---|---|
4 |
Outer block surface |
58Ni(n,p)58Co |
Yes |
14 |
Outer block surface |
115In(n,g)116In |
Yes |
24 |
Outer block surface |
115In(n,n’)115m1 In |
Yes |
34 |
Outer block surface |
58Ni(n,p)58Co |
No |
44 |
Outer block surface |
115In(n,g)116In |
No |
54 |
Outer block surface |
115In(n,n’)115m1 In |
No |
- For case 2
Track length flux tallies have been used to collect results in the cells corresponding to the activation foils in MCNP geometry at different positions within the block. The tallies have been multiplied in each input (with FM card) by the appropriate microscopic reaction cross section, to obtain results in terms of number of reactions per unit neutron from the source. No energy bins were used. Nuclear data for tally collection was taken from IRDFF-II dosimetry libraries. In the following, a list of the reactions considered for each activation foil material is reported.
Tally No. |
Where |
Foils Reactions |
Energy binning |
|---|---|---|---|
4 |
Within the block - Plate No. 8 |
197Au(n,g)198Au |
Yes |
14 |
(same as above) |
58Ni(n,p)58Co |
Yes |
24 |
(same as above) |
181Ta(n,g)182Ta |
Yes |
34 |
(same as above) |
63Cu(n,g)64Cu |
Yes |
44 |
Within the block - Plate No. 9 |
197Au(n,g)198Au |
Yes |
54 |
(same as above) |
58Ni(n,p)58Co |
Yes |
64 |
(same as above) |
181Ta(n,g)182Ta |
Yes |
74 |
(same as above) |
93Nb(n,2n)92mNb |
Yes |
84 |
(same as above) |
63Cu(n,g)64Cu |
Yes |
94 |
Within the block - Plate No. 10 |
197Au(n,g)198Au |
Yes |
104 |
(same as above) |
58Ni(n,p)58Co |
Yes |
114 |
(same as above) |
181Ta(n,g)182Ta |
Yes |
124 |
(same as above) |
63Cu(n,g)64Cu |
Yes |
134 |
Within the block - Plate No. 11 |
197Au(n,g)198Au |
Yes |
144 |
(same as above) |
58Ni(n,p)58Co |
Yes |
154 |
(same as above) |
181Ta(n,g)182Ta |
Yes |
164 |
(same as above) |
63Cu(n,g)64Cu |
Yes |
174 |
Within the block - Plate No. 8 |
197Au(n,g)198Au |
No |
184 |
(same as above) |
58Ni(n,p)58Co |
No |
194 |
(same as above) |
181Ta(n,g)182Ta |
No |
204 |
(same as above) |
63Cu(n,g)64Cu |
No |
214 |
Within the block - Plate No. 9 |
197Au(n,g)198Au |
No |
224 |
(same as above) |
58Ni(n,p)58Co |
No |
234 |
(same as above) |
181Ta(n,g)182Ta |
No |
244 |
(same as above) |
93Nb(n,2n)92mNb |
No |
254 |
(same as above) |
63Cu(n,g)64Cu |
No |
264 |
Within the block - Plate No. 10 |
197Au(n,g)198Au |
No |
274 |
(same as above) |
58Ni(n,p)58Co |
No |
284 |
(same as above) |
181Ta(n,g)182Ta |
No |
294 |
(same as above) |
63Cu(n,g)64Cu |
No |
304 |
Within the block - Plate No. 11 |
197Au(n,g)198Au |
No |
314 |
(same as above) |
58Ni(n,p)58Co |
No |
324 |
(same as above) |
181Ta(n,g)182Ta |
No |
334 |
(same as above) |
63Cu(n,g)64Cu |
No |
Implemented broadening on Monte Carlo computed results#
Following the ICSBEP documentation, MCNP neutron spectra are broadened with a Gaussian function using a constant 10% FWHM for all energy ranges for the hydrogen proportional counters while as per the table below for the stilbene scintillation detector.
Elow (MeV) |
FWHM (%) |
|---|---|
17.02 |
1 |
15.05 |
1.35 |
13.63 |
1.65 |
12.5 |
1.92 |
11.42 |
2.23 |
11.02 |
2.35 |
10.97 |
2.37 |
10.67 |
2.47 |
9.96 |
2.73 |
9.3 |
3.01 |
8.05 |
3.68 |
6.59 |
4.97 |
5.91 |
6.07 |
5.46 |
7.41 |
5.25 |
8.61 |
5.13 |
10 |
See also
Related papers and contributions:
ICSBEP, NEA/NSC/DOC/(95)03/VIII, Volume VIII, ALARM-CF-SST-SHIELD-001.
M. Schulc et al., “Measuring neutron leakage spectra using spherical benchmarks with 252Cf source in its centers”, Nucl. Instrum. Methods Phys. Res. A 914 (2019) 53-56.
M. Schulc et al., “Application of 252Cf neutron source for precise nuclear data experiments”, Appl. Radiat. Isot. 151 (2019) 187-195.
M. Schulc et al., “Comprehensive stainless steel neutron transport libraries validation”, Annals of Nuclear Energy 179 (2022) 109433.
(RCR-Fe+Ni) RCR Iron/Nickel Sphere Experiment with 252Cf source#
This benchmark was designed to evaluate fast neutron leakage spectra and neutron activation from an Iron and Nickel sphere of 50cm of diameter and with a 252Cf (spontaneous fission) neutron source placed in its centre. The experimental measurements were carried out in 2021 at the Neutron Source Laboratory (NSL) in the Research Centre Řež (RCR, Centrum Výzkumu Řež) by the proton recoil method and by evaluating the reaction rates in irradiated activation foils.
The experiment is identified as ALARM-CF-Fe-SHIELD-002 in the ICSBEP database.
Benchmark structure#
The benchmark is organized into two single experimental case which just differs by the sphere material.
- Material
Case-1: Iron
Case-2: Nickel
- Objective
measure the direct fast neutron leakage and its energy spectrum from the Fe sphere.
measure the spatial distribution of neutron-induced reaction rates on the surface of the sphere.
- Method
#. Proton recoil method using hydrogen proportional counters (HPD, 0.1-1.3 MeV neutrons) and a stilbene scintillation detector for 0.8-12 MeV neutrons, with digital pulse shape discrimination for neutron/gamma separation. #. Activation foils (58Ni(n, p)58Co, 115In(n, n’)115m1) are placed at defined positions on the sphere surface and irradiated during the neutron leakage measurements.
Geometry and run parameters#
- Sphere dimensions and materials
Case-1: 50 cm Fe sphere
Case-2: 50 cm Ni Sphere
- Density
Case-1 Iron sphere: 7.85 \(g/cm^3\)
Case-2 Nickel sphere: 8.89 \(g/cm^3\)
- Material
Composition determined by XRF analysis: * Case-1 Iron sphere: Fe 99.737%, Mn 0.075%, P 0. 025%, C 0.04%, S 0.026%, Al 0.005%, Mo 0. 01%, Cr 0.02%, Cu 0.062%. * Case-2 Nickel sphere: Ni 99.631%, Mo 0.007%, Fe 0.21%, W 8.45E-05%, Al 0.102%, Gd 7.40E-07%, Cr 0.022%, B 5.00E-06%, Mn 0.019%, Cd 8.32E-06%, Cu 0.01%.
- Source
252Cf oxide in a palladium matrix, encapsulated in double stainless-steel cladding.
- Source position
Geometric center of the sphere, placed in a 2.6 cm diameter, 28 cm deep hole drilled in a central 3 cm thick plate.
- Experimental hall
Room dimensions \(7.24\,\mathrm{m} \times 6.5\,\mathrm{m} \times 7.2\,\mathrm{m}\) (height), sphere center 2 m above floor.
- Set-up of case
It contains only the activation foils on the outside the Fe sphere (on the surface) and the neutron detectors at 1 m from the sphere center.
Figure 1. Scheme of Iron/Nickel Sphere - Side View. Dimensions in cm.#
Figure 2. Photo of Iron Sphere with Shadow Cone and Stilbene Detector.#
MCNP modelling#
Two independent MCNP inputs are employed, one for each case, just with different sphere material and with the hereinafter described tallies:
- Detector tallies, Fn5 MCNP type
Two detector-flux tallies have been used to collect the energy-binned neutron spectra at the same detector position with a course energy binning (F5, for the Stilbene detector) and a finer one (F15 for the hydrogen proportional counters, HPD) which matches the measurement performed.
- Track length flux tallies, Fn4 MCNP type
A track length flux tally has been used to collect results in the cells corresponding to the activation foils in MCNP geometry. The tally has been multiplied in each input (with FM card) by the appropriate microscopic reaction cross section, to obtain results in terms of number of reactions per unit neutron from the source. Energy binning was applied to half of the tallies, while the other half recorded the total reaction rate in the same cells (see table below). Nuclear data for tally collection was taken from IRDFF-II dosimetry libraries and experimental values averaged when multiplies values where present. In the following, a list of the reactions considered for each activation foil material is reported:
Tally No. |
Where |
Foils Reactions |
Energy binned |
|---|---|---|---|
4 |
Outer sphere surface |
58Ni(n,p)58Co |
Yes |
14 |
Outer sphere surface |
115In(n,n’)115m1 In |
Yes |
24 |
Outer sphere surface |
58Ni(n,p)58Co |
No |
34 |
Outer sphere surface |
115In(n,n’)115m1 In |
No |
Implemented broadening on Monte Carlo computed results#
Following the ICSBEP documentation, MCNP neutron spectra are broadened with a Gaussian function using a constant 10% FWHM for all energy ranges for the hydrogen proportional counters while as per the table below for the stilbene scintillation detector.
Elow (MeV) |
FWHM (%) |
|---|---|
17.02 |
1 |
15.05 |
1.35 |
13.63 |
1.65 |
12.5 |
1.92 |
11.42 |
2.23 |
11.02 |
2.35 |
10.97 |
2.37 |
10.67 |
2.47 |
9.96 |
2.73 |
9.3 |
3.01 |
8.05 |
3.68 |
6.59 |
4.97 |
5.91 |
6.07 |
5.46 |
7.41 |
5.25 |
8.61 |
5.13 |
10 |
See also
Related papers and contributions:
ICSBEP, NEA/NSC/DOC/(95)03/VIII, Volume VIII, ALARM-CF-Fe-SHIELD-002.
M. Schulc et al., “Measuring neutron leakage spectra using spherical benchmarks with 252Cf source in its centers”, Nucl. Instrum. Methods Phys. Res. A 914 (2019) 53-56.
M. Schulc et al., “Application of 252Cf neutron source for precise nuclear data experiments”, Appl. Radiat. Isot. 151 (2019) 187-195.
ISIS Benchmark Experiment on Deep-Penetration Neutrons through Concrete and Iron Shields WITH 800 MeV PROTONS#
Important
This benchmark is part of the SINBAD collection and cannot be freely distributed with JADE.
The purpose of this experiment was to measure the deep-penetration neutrons through a thick bulk shield at an intense spallation neutron source facility, ISIS, of the Rutherford Appleton Laboratory (RAL), United Kingdom.
The experiments were performed with 800MeV protons. The protons stopped on a Tantalum target of 30cm effective thickness, located in a vacuum chamber and cooled by heavy water (D2O).
Different measurements were performed during the experiments to fully cover the neutron spectrum, including solid state neutron track detectors (SSNTD), thermoluminiscent dosimeters (TLD), activation detectors and an indium activation multi-moderator detector. The fast neutron flux was measured with the activation threshold detectors by using the C12(n,2n)C11, Al27(n,a)Na24 and the various threshold Bi209(n,xn)Bi210-x reactions. The activation of C12 dosimeters was measured between layers of ordinary concrete and stell located on top of the biological shield, i.e. at an emission angle of 90º relative to beam direction.
In this experiment additional shielding slabs of ordinary concrete and iron were placed upon the top center of the bulk shield just above the target, as shown in Fig. 1. Figs. 2 - 4 show photos of this experiment at the top of the target station. The additional concrete and iron were assembled by 119-cm-diameter by 20-cm-thick slabs of 2.36-g/cm3 density, and 119-cm-diameter by 10-cm-thick slabs of 7.8-g/cm3 density, respectively. The concrete slabs contained iron mesh for reinforcement. The experiment is identified as NEA-1552/38 in the SINBAD database.
Geometry and run parameters#
Fig. 1: Horizontal and vertical cross-sectional views of iron igloo and additional shield.#
The five detector positions of “center”, “up”, “down”, “left” and “right” are shown as white circles in the upper figure.
Fig. 2: Experimental setup with a 120-cm-thick additional concrete shield and surrounding#
iron igloo at the top center of the target station.
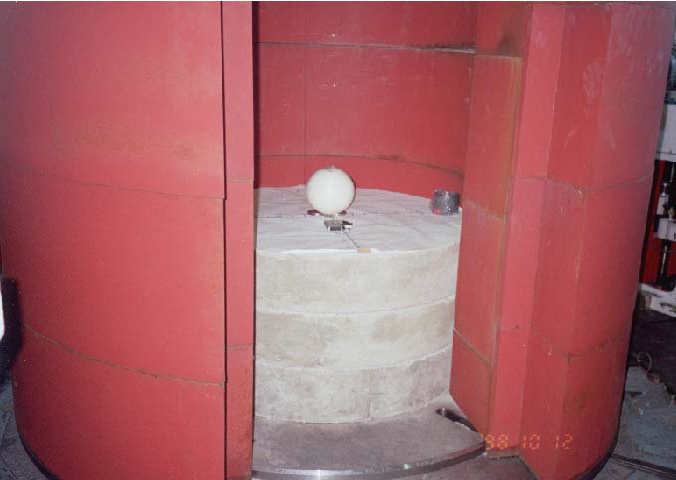
Fig. 3: Experimental setup with a 60-cm-thick additional concrete shield using activation#
detectors and a Bonner sphere.
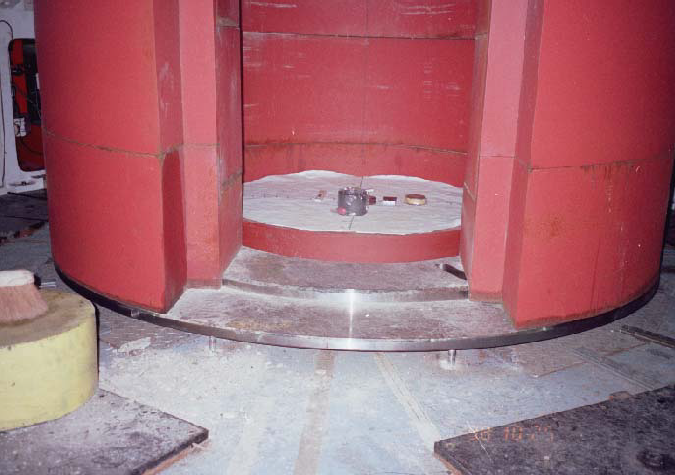
Fig. 4: Experimental setup with a 10-cm-thick additional concrete shield using activation#
detectors.
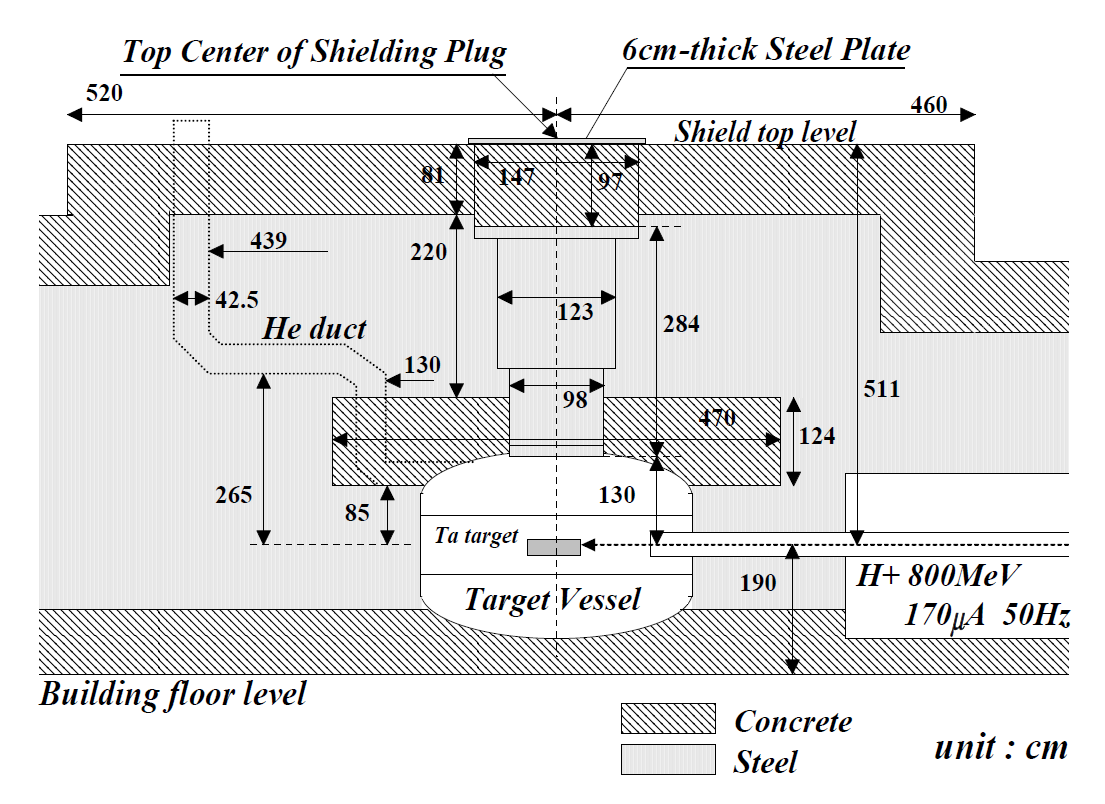
Fig. 5: Cross-sectional view of the neutron spallation target station with an 800-MeV#
proton beam at ISIS.
Tallies#
The following quantities have been compared with the experimental results:
Reaction rate of C12(n,2n)C11 at the center position behind the additional concrete and iron shields.
Corresponding to the tally 14 and 24 of the input file.
Those quantities have been scored in a 0.1 mm thickness cylinder located at 90 degrees from the beam direction, behind the additional shielding, more precisely at 20, 40, 60, 80 and 100 cm from the additional concrete shield, and at 10, 20, 30, 40 and 50 cm from the additional iron shield.
See also
Related papers and contributions:
OECD Nuclear Energy Agency Data Bank SINBAD, http://www.oecd-nea.org/science/wprs/shielding/sinbad/sinbadis.htm
Nunomiya, N. Nakao, P. Wright, T. Nakamura, E. Kim, T. Kurosawa, S. Taniguchi, M. Sasaki,, H. Iwase, Y. Uwamino, T. Shibata, S. Ito, D.R. Perry “Measurements of deep penetration of neutrons produced by 800MeV proton beam through concrete and iron at ISIS” Nuclear Instruments and Methods in Physics Research B179 (2001) 89-102.
Kitsos and I. Kodeli. SINBAD Compilation NEA-1552/21 “ISIS Deep-Penetration of Neutrons through Concrete and Iron shields”
Nunomiya, N. Nakao, P. Wright, T. Nakamura, E. Kim, T. Kurosawa, S. Taniguchi, M. Sasaki,, H. Iwase, Y. Uwamino, T. Shibata, S. Ito, D.R. Perry. “Experimental Data of Deep Penetration Neutrons through a Concrete and Iron Shield at the ISIS Spallation Neutron Source Facility using an 800MeV Proton Beam” KEK Report 2001-24 (February 2002).
Uwamino, T Shibata, T. Ohkubo, S. Sato and D. Perry. Proceedings of SATIF-1, page 185. Arlington, Texas (1994).